This notebook is an excerpt from the set of full notebooks which can be found on the Wolfram Cloud, starting with: EpidemiologicalModelsForInfluenzaAndCOVID-19--part_1.nb
Introduction
Introduction
The COVID-19 outbreak, initially in China and now throughout the world, has captured the interest of a large number of organizations and individuals alike. Some effort has been spent to model (or at least visualize) the geographic spread [JHU][JEP]. There have also been some reports of epidemiological models [TG][PYZ][ZCW][JDL][EGE][AA] that have been developed in an effort to estimate parameters that can be used to project the severity of the outbreak, its duration, and the mortality rate.
This report has to main goals. 1) It aims to put some of these modeling efforts into perspective so that conclusions and predictions can be better understood. We will be using compartmental models that allow one to describe the flow of individuals from one health state to another. We will attempt to employ just the right kinds of compartments and connections that are supported by the available data. As the noted statistician G. E. P. Box admonished us, “All models are wrong, but some models are useful.” It is also important know the assumptions on which the models are predicated. 2) It demonstrates the breadth of the Wolfram Language which makes these analyses relatively straight forward, from the retrieval of data from the web, to modeling and data fitting, to exposition and presentation, all in a single interactive document.
It is instructive to first examine two influenza outbreaks that occurred in 1978 in two different boarding schools. The two populations were well defined in terms of size and the assumption of rapid and uniform mixing. These two examples demonstrate that the reported retrospective data can be analyzed satisfactorily by mechanistically different models, and that limitations of the models sometimes preclude the explanation of all the observations.
Next we explore several epidemiological models for the COVID-19 outbreak, and use data from various provinces to estimate model parameters. We primarily want to see how similar or dissimilar the the outbreaks are to each other, point out the short comings, and make some suggestions for improvements.
Compartmental models
Compartmental models
We will be using compartmental models, which have had numerous applications in biology, ecology, chemistry, and medicine. For our purposes, each compartment represents a group of individuals in the same health state, for example susceptible or infectious. The connections between compartments indication the direction and rate of movement from one health state to another. One of the simplest compartmental models for epidemiology has three compartments: susceptible, infectious, and recovered, or SIR. Susceptible individuals come in contact with infectious individuals and become infected. After some period of time, infectious individuals recover, are not longer infectious, and have permanent immunity. The process can be described as a set of transitions
βλ[t] → | infection |
ℐ γ → | recovery |
Schematically, the model looks like this

For clarity, we will use a slightly different form of schematic diagram known as a Petri net, which looks like this

There is code in the Initialization section at the end of the notebook for generating these graphs.
Each compartment becomes a time-dependent variable in the model. The coefficient is the transmission rate constant, and is the force of infection. It is a function of all the infectious compartments in the model (in this case, just ), and thus is time-dependent. The parameter is the recovery rate constant, and is defined as , where is the average duration of infection.
β
λ[t]
ℐ[t]
γ
γ
1
τ
τ
This transmission model describes the rate of change of each of the compartments, which can be modeled mathematically as a system of ordinary differential equations (ODEs).
′ |
′ ℐ |
′ ℛ |
λ[t]ℐ[t] |
The number of infectious individuals in the population is the prevalence of the disease. The number of individuals that become infected per unit time is called the incidence.
ℐ[t]
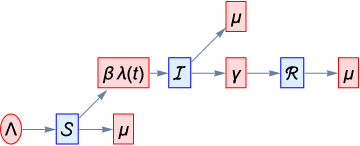
Many epidemiologic models include population demographics, that is, birth and natural death. For comparison, this is the SIR model with demographics
Λ ↦ | birth |
βλ[t] → | infection |
ℐ γ → | recovery |
μ ⇥ | death |
ℐ μ ⇥ | death |
ℛ μ ⇥ | death |
′ |
′ ℐ |
′ ℛ |
λ[t]ℐ[t] |
The shape for in the schematic diagram is different because its units are , whereas all the other rates are .
Λ
persons
time
1
time
Because the duration of the influenza and COVID-19 outbreaks that are discussed here are so short (weeks or months), we can make the assumption that births and natural deaths can be ignored.
These compartmental models and their ODE representation were first developed by Kermack and McKendrick [KM] almost 100 years ago. One of the assumptions is that the population of individuals is well mixed, that is, every individual has equal likelihood to come into contact with every other individual. This assumption rarely holds in practice, but useful results can be obtained nonetheless. Other assumptions to keep in mind are that all individuals in each class are identical, and that recovery confers life-long perfect immunity.
Basic reproduction number
Basic reproduction number
The rate constants i these models can be used to estimate various epidemiological parameters, such as average recover time . Another parameter that is often used to characterize epidemics is the basic reproduction number, or R0. It represents the number of individuals a single infected individual will infect in a completely susceptible population during her/his lifetime. If the value is less than 1, the outbreak will die out. If it is greater than 1, then the epidemic will persist. A very good description of this parameter, its uses, and what various values greater than 1 mean was recently published [
1
γ
EY
].Delay differential equations
Delay differential equations
While delay differential equations (DDE) are often used in population models for ecology, and many other areas as well, they can lead to unphysical artefacts. For example, shown below is the SIR model solution (solid curves) and the solution for the corresponding DDE model (dashed curves). While the total population size () is constant, the infected compartment in the DDE model (dashed red) has several excursions below 0 and the recovered compartment (dashed blue) has corresponding excursions above . Adding a scaling factor to those terms in the DDEs will only minimize and not eliminate the issue. The oscillations are also of concern.
[t][t]+ℐ[t]+ℛ[t]
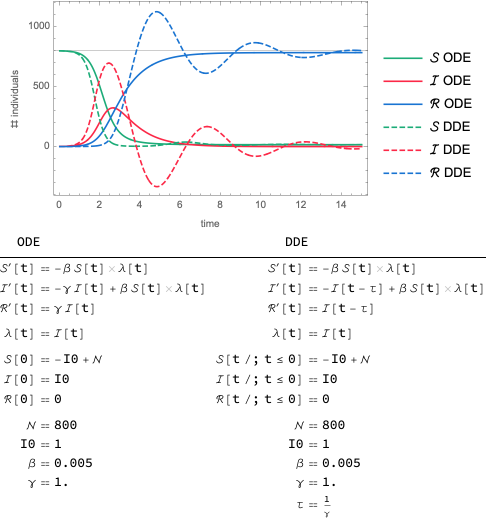
While DDE models have been used for epidemiological models [AV], they must be used with care.
Parameter optimization
Parameter optimization
All of the parameters in these model need to remain in the range or , so constraints should be used. Wolfram Language has many efficient functions for optimization with constraints, and for many systems they work well. From many years of experience with these kinds of models (epidemiologic, pharmacokinetic, and viral dynamics), a simpler passive constraint method (transformation) with unconstrained optimization works better.
(0,∞)
(0,1)
Values for parameters that should fall between 0 and ∞ are log-transformed and the parameters in the ODEs are back-transformed with . Similarly, for parameters whose values should be between 0 and 1 we use the logit transformation and its inverse. To facilitate coding, the functions , , , and are defined in the initialization section.
Exp
toLog
fromLog
toLogit
fromLogit
toLog, fromLog
toLog
fromLog
toLog[x_] := Log[x]
fromLog[y_] := Exp[y]
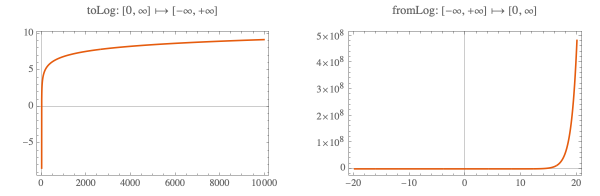
fromLog[toLog[x]]x
Out[]=
True
toLogit, fromLogit
toLogit
fromLogit
toLogit[x_] := Log[x/(1 - x)]
fromLogit[y_] := Exp[y]/(1 + Exp[y])
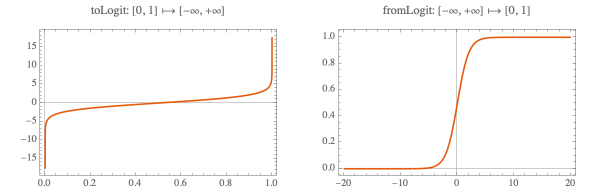
fromLogit[toLogit[x]]x//Simplify[#,Assumptionsx∈Reals]&
Out[]=
True
Influenza
There are two textbook examples of influenza outbreaks in boarding schools. They are retrospective reports because the studies were unplanned, however, from a modeling perspective they present several advantages:
◼
The populations were closed (no migration in or out)
◼
There were no births or deaths, so models without demographics can be used
◼
The populations were well mixed as the students were attending classes together
◼
There is a daily record of the number of students with influenza
The data
The data
Outbreak 1
Outbreak 1
Dataset
Dataset
◼
From a textbook problem, Martcheva. pp. 126-139 [MM][A]
…, in January-February 1978, an epidemic of influenza occurred in a boarding school in the north of England. The boarding school housed a total of 763 boys, who were at risk during the epidemic. On January 22, three boys were sick.
512 boys (67%) spent between three and seven days away from class, …
Fitting data
Fitting data
Outbreak 2
Outbreak 2
Dataset
Dataset
◼
From another textbook problem, Martcheva, pp. 144-145 [MM][HJR]
The West Country English Boarding School housed 578 boys. An epidemic of influenza began on 15 January 1978.
One hundred and sixty-six boys (29 per cent) were treated in the sick bays by bed rest and aspirin. Certainly this is not the total number with influenza, as the older boys had their own rooms in which some remained, treating themselves and avoiding detection and supervision as a result of the dislocated curriculum.
Fitting data
Fitting data
SEIR Model
SEIR Model
◼
SEIR: SIR model with exposed compartment
◼
No birth or natural mortality due to short time span of coverage of model
◼
Mass action incidence
◼
These are the transitions:
◼
These are the ODEs
First dataset
First dataset
Manual fit
Manual fit
Statistical fit
Statistical fit
Sensitivity analysis
Sensitivity analysis
Total incidence & epidemic size
Total incidence & epidemic size
◼
Nearly every boy is predicted to become infected, whereas only 512 boys (67%) were reported to have been confined to bed
Second dataset
Second dataset
SEIQR Model
SEIQR Model
Since the data report the “number of boys confined to bed”, they are actually quarantined or isolated and not freely circulating among the student body
◼
SEIQR: SEIR model with quarantined compartment
◼
No birth or natural mortality due to short time span of coverage of model
◼
Mass action incidence
◼
These are the transitions:
◼
These are the ODEs
First dataset
First dataset
Second dataset
Second dataset
Manual fit
Manual fit
Statistical fit
Statistical fit
Sensitivity analysis
Sensitivity analysis
Total incidence & epidemic size
Total incidence & epidemic size
◼
Again, overestimating the epidemic size, but much improved over the model without quarantine
Summary
Summary
Parameter values and statistics
Parameter values and statistics
Goodness of fit
Goodness of fit
◼
For the first influenza dataset, the SEIR model is somewhat better than the SEIQR model
◼
For the second influenza dataset, the SEIQR model is much better than the SEIR model
Epidemiological parameters
Epidemiological parameters
◼
SEIR model
◼
SEIQR model
◼
Biggerstaff et al. [BCR] report much smaller values for the basic reproduction number for influenza:
General observations & conclusions
General observations & conclusions
◼
Retrospective data without full details of collection can be interpreted in different ways
◼
Recapitulating heterogenous data (e.g., prevalence and epidemic size) can be difficult
◼
Different models may do better for different datasets for the same disease
Suggestions for follow-up and improvements
Suggestions for follow-up and improvements
◼
Recent reading [MM][FT] suggests that standard incidence should be used for SEIQR models
◼
Investigate the effect on model fitting
◼
investigate the effect on the basic reproduction number
◼
Try Jacobian method [MM]
◼
Try next generation method [MM]
COVID-19
Epidemic data from Wolfram Data Repository (WDR)
Epidemic data from Wolfram Data Repository (WDR)
◼
The Johns Hopkins University data are available from the Wolfram Data Repository, and are described at https://www.wolframcloud.com/obj/resourcesystem/published/DataRepository/resources/Epidemic-Data-for-Novel-Coronavirus-COVID-19
◼
Note: a correction to the confirmed cases data for Hubei is applied [BK]
◼
Get the population size for the top three provinces
Models
Models
◼
We’ll explore a number of models, hoping to find one with a reasonable structure that recapitulates the reported data
◼
SEIRD: SEIR model with dead compartment
◼
SEIQRD: SEIQR model with dead compartment
◼
SEIsaRD: SEIR model with symptomatic and asymptomatic infectious compartments
◼
We’ll explore all the the models for one location, then apply the “best” model to the other locations
◼
We’ll examine alternative models with full and effective population sizes
◼
Full population sizes will come from Wolfram|Alpha
◼
We’ll examine alternative models with mass action or standard incidence
◼
General assumptions:
◼
No birth or natural mortality due to short time span of coverage of model
◼
Death due to disease will be included
◼
There is no migration into or out of the population
◼
We don’t know with certainty when the first infection occurred
◼
Du et al. assumed 1 Dec 2019 [DWC]
◼
We will examine datasets assuming the first infections occurred on 20 Dec 2019, and 30 Dec 2019 (when the first reported infections)
◼
Even though the severity of the infection and risk of death have been reported to be age- and gender-dependent, the available data for modeling does not have sufficient detail to support stratification by age and gender
◼
Under reporting of cases is a serious concern, primarily due to the infection being asymptomatic in many individuals, especially children [CXL]; we will assume that all cases are reported
◼
This work was carried out over a number of days, with the available WDR data keeping pace. However to assure a consistent analysis and interpretation of results we’ll work with data for the period 21 Jan 2020 to 26 Feb 2020.
◼
More recent data can be used to test the models.
Hubei outbreak—SEIRD
Hubei outbreak—SEIRD
SEIRD Model with standard incidence
SEIRD Model with standard incidence
◼
SEIRD: SEIR model with dead compartment
◼
This assumes that individuals in the population cannot come in contact with all other individuals in the population; this is in contrast to models for influenza and SARS [MM]
◼
These are the transitions:
◼
These are the ODEs
outbreak start 20 Dec 2019
outbreak start 20 Dec 2019
Fitting data
Fitting data
Manual fit
Manual fit
◼
The table below shows the estimates for the epidemiological parameters
◼
the average duration of infection takes into account both recovery and death
◼
The table below shows the estimates for the epidemiological parameters
◼
the average duration of infection takes into account both recovery and death
◼
The first three and last two fits are essentially the same
◼
The fourth fit under-predicts the deaths
outbreak start 30 Dec 2019
outbreak start 30 Dec 2019
Fitting data
Fitting data
Comparisons
Comparisons
◼
increasing the population size makes ℐ peak broader
◼
shifting t0 to a later date (closer to the data) does not have a noticeable effect
◼
in all cases, the susceptible compartment goes to 0 and the epidemic size is 100% of the population
Hubei outbreak—SEIQRD
Hubei outbreak—SEIQRD
SEIQRD Model with standard incidence
SEIQRD Model with standard incidence
◼
SEIQRD: SEIQR model with dead compartment
◼
The duration of circulation of infected individuals is constant even though we know it was initially infinitely long and later became very short as isolation and quarantine measures were instituted, however no detailed information about when changes occurred is available
◼
The duration of infection and the mortality rate for circulating and quarantined infectious individuals is the same
◼
These are the transitions:
◼
These are the ODEs
outbreak start 20 Dec 2019, 30 Dec 2019
outbreak start 20 Dec 2019, 30 Dec 2019
Comparisons
Comparisons
◼
increasing the population size makes and ℛ rise more slowly, and decreases the epidemic size
◼
shifting t0 to a later date (closer to the data) appears to make the peak narrower, and reverses the population size trends for β and δ
Hubei outbreak—SEIsaRD
Hubei outbreak—SEIsaRD
SEIsaRD Model
SEIsaRD Model
◼
SEIsaRD: SEIR model with symptomatic and asymptomatic infectious compartments
◼
Standard incidence
◼
The duration of infection for symptomatic and asymptomatic infectious individuals is the same
◼
We have two different recovered compartments for book keeping
◼
death due to disease occurs only for symptomatic infectious individuals
◼
These are the transitions:
◼
These are the ODEs
outbreak start 20 Dec 2019
outbreak start 20 Dec 2019
Comparisons
Comparisons
◼
Increasing the population size increases the recovery rate
◼
in all cases, the susceptible compartment goes to 0 and the epidemic size is 100% of the population
Summary
Summary
◼
All three models (SEIRD, SEIQRD, and SEIsaRD) exhibit long exponential tails for the ℐ or peak
◼
The recovered compartment never recovers as fast as the data
◼
The deaths compartment is usually fit well
◼
Most of the models gave an epidemic size of 100 %
◼
More work is needed
Suggestions for improvements & new studies
Suggestions for improvements & new studies
◼
Coburn et al. [CWB] describe an isolation compartment in equilibrium with the susceptible compartment
◼
This compartment effectively reduces the susceptible compartment size and should allow mass action incidence to be used
◼
Jia et al. [JDL] use a similar compartment for their COVID-19 model, as well as mass action incidence
◼
New model under consideration
◼
Are the data for Hubei too idiosyncratic for modeling? Are the data from another province or country (e.g., South Korea) more amenable to modeling?
References
[JHU] “Mapping 2019-nCoV”, https://systems.jhu.edu/research/public-health/ncov/
[JEP] J. Espigule-Pons “Mapping Novel Coronavirus COVID-19 Outbreak”, https://community.wolfram.com/groups/-/m/t/1868945
[TG] T. Götz, “First attempts to model the dynamics of the coronavirus outbreak 2020”, https://arxiv.org/pdf/2002.03821.pdf
[PYZ] L. Peng, W. Yang, D. Zhang, C. Zhuge, L. Hong “Epidemic analysis of COVID-19 in China by dynamical modeling”, https://www.medrxiv.org/content/10.1101/2020.02.16.20023465v1
[ZCW] Y. Zhou, Z. Chen, X. Wu, Z. Tian, L. Cheng, L. Ye “The Outbreak Evaluation of COVID-19 in Wuhan District of China”, https://arxiv.org/pdf/2002.09640.pdf
[JDL] J. Jia, J. Ding, S. Liu, G. Liao, J. Li, B. Duan, G. Wang, R. Zhang “Modeling the Control of COVID-19: Impact of
Policy Interventions and Meteorological Factors”, https://arxiv.org/pdf/2003.02985.pdf
Policy Interventions and Meteorological Factors”, https://arxiv.org/pdf/2003.02985.pdf
[EGE] E. G. M E. “An SEIR like model that fits the coronavirus infection data”, https://community.wolfram.com/groups/-/m/t/1888335
[AA] A. Antonov “Basic experiments workflow for simple epidemiological models”, https://community.wolfram.com/groups/-/m/t/1895686
[KM] W.O. Kermack, A. G. McKendrick “Contributions to the Mathematical Theory of Epidemics—I” reprinted in Bull. Math. Biol., 53, 33-55 (1991). https://link.springer.com/article/10.1007/BF02464423
[EY] E. Yong “The Deceptively Simple Number Sparking Coronavirus Fears”, The Atlantic, 28 Jan 2020, https://www.theatlantic.com/science/archive/2020/01/how-fast-and-far-will-new-coronavirus-spread/605632/
[AV] J. Arino, P. van den Driessche “Time delays in Epidemic Models; Modeling and Numerical Considerations” in “Delay Differential Equations and Applications”, O. Arino (ed.) Springer, 2006.
[FB] F. Brauer “Reproduction numbers and final size relations”, https://www.fields.utoronto.ca/programs/scientific/10-11/drugresistance/emergence/fred1.pdf
[BCR] M. Biggerstaff, S. Cauchemez, C. Reed, M. Gambhir, L. Finelli “Estimates of the reproduction number for seasonal, pandemic, and zoonotic influenza: a systematic review of the literature” BMC Infectious Diseases, 14, 480 (2014), http://www.biomedcentral.com/1471-2334/14/480
[MM] M. Martcheva “An introduction to mathematical epidemiology” Springer, 2015.
[A] Anonymous, Anonymous, Brit. Med. J., 1978, https://www.ncbi.nlm.nih.gov/pmc/articles/PMC1603269/pdf/brmedj00115-0064.pdf
[HJR] H. J. Rose “The use of amantadine and influenza vaccine in a type A influenza epidemic in a boarding school”, Journal of Royal College of General Practitioners, 30, 619-621 (1980). PubMedCentral
[FT] Z. Feng, H. R. Thieme “Recurrent Outbreaks of Childhood Diseases Revisited: The Impact of Isolation”, Math. Biosciences, 128, 93-130 (1995). https://doi.org/10.1016/0025-5564(94)00069-C
[BK] S. Boseley, L. Kuo “Huge rise in coronavirus cases casts doubt over scale of epidemic”, The Guardian, 13 Feb 2020, https://www.theguardian.com/world/2020/feb/13/huge-rise-coronavirus-cases-raises-doubts-scale-epidemic-china
[DWC] Z. Du, L. Wang, S. Cauchemex, X. Xu, X. Wang, B. J. Cowling, L. A. Meyers “Risk for Transportation of 2019 Novel Coronavirus (COVID-19) from Wuhan to Cities in China”, https://doi.org/10.1101/2020.01.28.20019299
[CXL] J. Cai, J. Xu, D. Lin, Z. Yang, L. Xu, Z, Qu, Y. Zhang, H. Zhang, R. Jia, P. Liu, X. Wang, Y. Ge, A. Xia, H. Tian, H. Chang, C. Wang, J. Li, J. Wang, M. Zheng “A Case Series of children with 2019 novel coronavirus infection: clinical and epidemiological features”, Clinical Infectious Diseases, https://doi.org/10.1093/cid/ciaa198
[CWB] B. J. Coburn, B. G. Wagner, S. Blower “Modeling influenza epidemics and pandemics: insights into the future of swine flu (H1N1)”, BMC Medicine, 7, (2009), http://www.biomedcentral.com/1741-7015/7/30
Initialization
CITE THIS NOTEBOOK
CITE THIS NOTEBOOK
Epidemiological models for Influenza and COVID-19
by Robert Nachbar
Wolfram Community, STAFF PICKS, March, 2020
https://community.wolfram.com/groups/-/m/t/1896178
by Robert Nachbar
Wolfram Community, STAFF PICKS, March, 2020
https://community.wolfram.com/groups/-/m/t/1896178