NASA’s Ocean Color satellites monoidal language is extended with multivariable integration and image segmentation. The image segmentation allows for integration over non-rectangular regions of interest in the satellite images. A Content Addressable Memory system is now included in the monoid to reduce the usage of the assignment operator = . The satellite images are used as addresses to index the monoid’s return values as well as interim computed variables.The monoidal language is an excellent training and teaching tool for calculus and even functional analysis starting from STEM students to graduate students. Note: More of these live notebooks will be released for a variety of variables and ocean regions, notebooks become too large and therefore each variable requires a notebook of its own.
ceanolors[]
ceanolors[]
In[]:=
DateObject[]
Out[]=
Part 1-α9.0

Software
Release: α9.0 .
Scripts: Symbolic computations performed in Wolfram Mathematica 14.3 .Notebook: https://www.wolframcloud.com/obj/ccn2/Published/ocean_colors_integrals.nb Support: Contact the author for additional code, bugs, correction in maths and algebraic/mathematical mistakes or invalid inferences.Nomenclature: Most functions and most identifiers start with lower case letters, all native vendor identifiers start with upper case. No Packaging: There is no software engineering applied to the code here nor elsewhere in the author’s technical notes to reduce the difficulties and version mismatches in future. The eager readers can simply copy paste the code or download and run the notebook. TODO: 0. Urgently require the color map peer-review to make sure it matches NASA’s satellite instruments documentation. 1. Full JSON ASCII output support for third party Python, JS, C/C++/C# programs.2. Image derivatives are taken on the gray level version of the image, in case the derivatives ought to be taken for each channel.3. One or several Cloud Objects containing the file, its monoids and parametrizations with API Functions for external interactions.This is critical and urgent to allow for large number of variables and scans while the size of the live code notebook would remain small. 4. Login, authorization and Hash for time-stamping and copyrights. 5. Interim images and other related data and computations saved into cloud objects.6. Integration over an image ✓ 7. PDE solutions over one image and over a family of images.8. Wavelets9. Volumetric or 3D image versions and animation flip-books TOLEARN:1. Color maps that match the coloration of the ocean waters as seen by the satellites ✓ 2. Animate regions of oceans Known Issues:1. A rule delayed ParametricPlot3D[ ] might not render with no errors. Running it twice all is normal. This case occurs when plotting the spline images.
© 2012-Present CCN StudiosCreative Commons Attribution-NonCommercial-ShareAlike 4.0

Cloud Import AQUA-MODIS Ocean Colors scans
Cloud Import AQUA-MODIS Ocean Colors scans
In[]:=
Notation`AutoLoadNotationPalette=False;Needs["Notation`"];ClearNotations[];CloudGet["https://wolfr.am/1BKwPgFcC"];ceanolors[]scan="AQUA_MODIS.20260208T003500.L2.OC.NRT.nc";
:scan's"attributes"

Out[]=
Version α9.0x,y,xy,yx,xx and yy are protected.,

Out[]=
{/,/geophysical_data,/geophysical_data/angstrom,/geophysical_data/aot_869,/geophysical_data/chlor_a,/geophysical_data/ipar,/geophysical_data/Kd_490,/geophysical_data/l2_flags,/geophysical_data/nflh,/geophysical_data/par,/geophysical_data/pic,/geophysical_data/poc,/geophysical_data/Rrs_412,/geophysical_data/Rrs_443,/geophysical_data/Rrs_469,/geophysical_data/Rrs_488,/geophysical_data/Rrs_531,/geophysical_data/Rrs_547,/geophysical_data/Rrs_555,/geophysical_data/Rrs_645,/geophysical_data/Rrs_667,/geophysical_data/Rrs_678,/navigation_data,/navigation_data/latitude,/navigation_data/longitude,/navigation_data/tilt,/processing_control,/processing_control/flag_percentages,/processing_control/input_parameters,/scan_line_attributes,/scan_line_attributes/clat,/scan_line_attributes/clon,/scan_line_attributes/csol_z,/scan_line_attributes/day,/scan_line_attributes/detnum,/scan_line_attributes/elat,/scan_line_attributes/elon,/scan_line_attributes/msec,/scan_line_attributes/mside,/scan_line_attributes/slat,/scan_line_attributes/slon,/scan_line_attributes/time,/scan_line_attributes/year,/sensor_band_parameters,/sensor_band_parameters/aw,/sensor_band_parameters/bbw,/sensor_band_parameters/F0,/sensor_band_parameters/k_no2,/sensor_band_parameters/k_oz,/sensor_band_parameters/Tau_r,/sensor_band_parameters/vcal_gain,/sensor_band_parameters/vcal_offset,/sensor_band_parameters/wavelength}
Review “/geophysical_data/chlor_a”
Review “/geophysical_data/chlor_a”
In[]:=
:"/geophysical_data/chlor_a"'s"long_name"
Out[]=
Chlorophyll Concentration, OCI Algorithm
In[]:=
:"/geophysical_data/chlor_a"'s"reference"
Out[]=
Hu, C., Lee Z., and Franz, B.A. (2012). Chlorophyll-a algorithms for oligotrophic oceans: A novel approach based on three-band reflectance difference, J. Geophys. Res., 117, C01011, doi:10.1029/2011JC007395.
Cloud Import “/geophysical_data/chlor_a”
Cloud Import “/geophysical_data/chlor_a”
In[]:=
:scan's"/geophysical_data/chlor_a"
Out[]=
attributes,map,globe,polygon,range,image0,image0 small,image,image small,SVG raw,SVG,relief,data,mask,mask small,cluster,filter,,,,,,,
,


x
y
xy
yx
xx
yy

What is “/geophysical_data/chlor_a” ?
What is “/geophysical_data/chlor_a” ?
Chlorophyll a is a specific form of chlorophyll used in oxygenic photosynthesis. It absorbs most energy from wavelengths of violet-blue and orange-red light, and it is a poor absorber of green and near-green portions of the spectrum. Chlorophyll does not reflect light but chlorophyll-containing tissues appear green because green light is diffusively reflected by structures like cell walls.
Source: https://en.wikipedia.org/wiki/Chlorophyll_a
Source: https://en.wikipedia.org/wiki/Chlorophyll_a
The chlor_a algorithm
The chlor_a algorithm
This algorithm [1] returns the near-surface concentration of the photosynthetic pigment chlorophyll a (chlor_a) in mg ,calculated using empirical relationships derived from in situ measurements of both chlor_a and spectral remote sensing reflectances (Rrs). The implementation is contingent on the availability of three or more sensor bands spanning the 440 - 670 nm spectral range. The algorithm is applicable to all current ocean color sensors. The chlor_a product is included as part of the NASA standard Level-2 OC product suite and the Level-3 CHL product suite.
-3
m
Out[]=
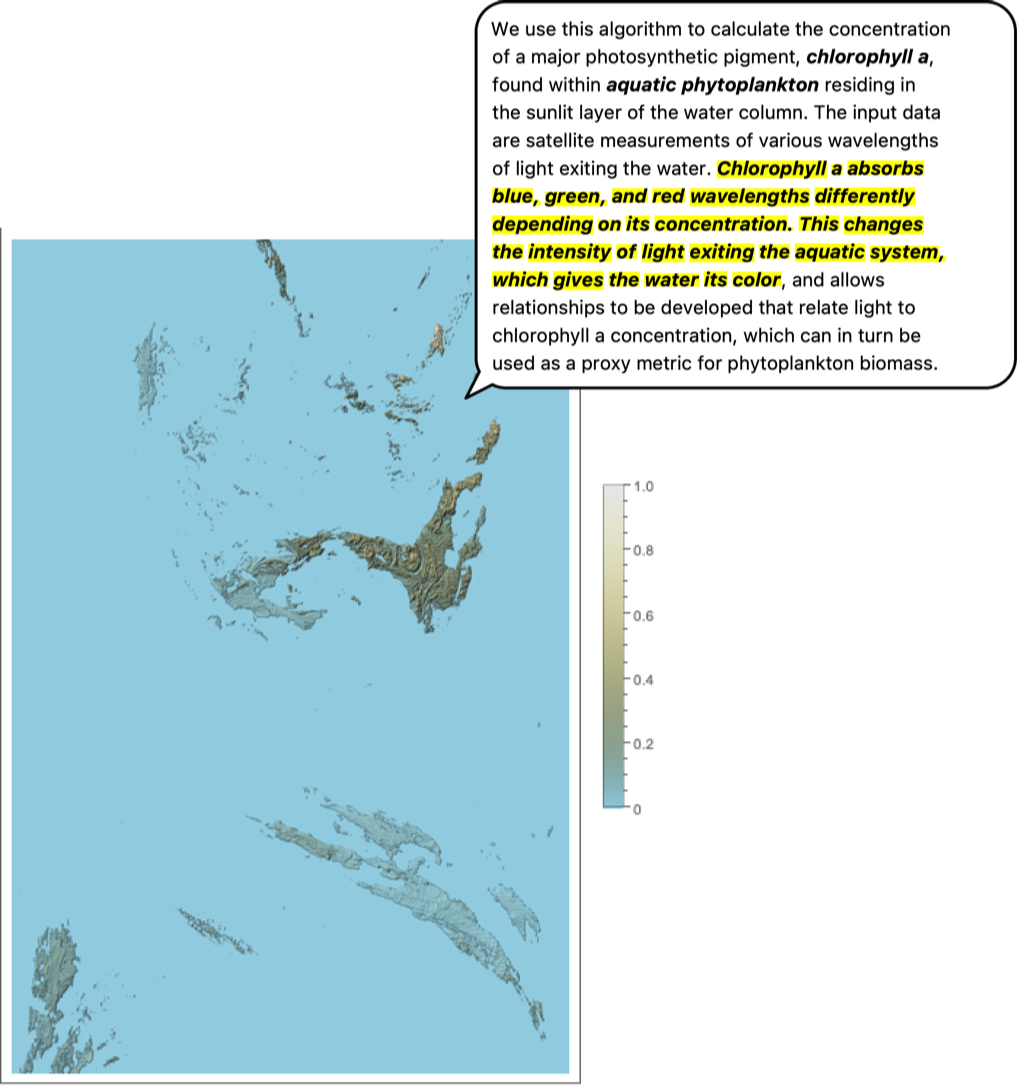
What are Phytoplankton?
What are Phytoplankton?
Color Maps
Color Maps
See reference [1] where the following image was selected with a side legend. The color maps below were computed using the Wolfram symbol called Blend[ ], and the actual pixel values were read off the screen. Unfortunately the NASA’s own references on this topic matter has not been discovered by this author as of yet.
Spline Image
Spline Image
Spline Image Derivative
Spline Image Derivative
References
References
◼
[1] Chlorophyll a, Jeremy Werdell and John O’Reilly and Chuanmin Hu and Lian Feng and Zhongping Lee and Bryan Franz and Sean Bailey and Christopher Proctor. https://www.earthdata.nasa.gov/apt/documents/chlor-a/v1.0#abstract
◼
[2] Aqua MODIS Level-2 Regional Ocean Color (OC) Data, version 2022.0
https://access.uat.earthdata.nasa.gov/collections/C1272940553-OB_CLOUD
https://access.uat.earthdata.nasa.gov/collections/C1272940553-OB_CLOUD
CITE THIS NOTEBOOK
CITE THIS NOTEBOOK
Ocean color calculus image integration NASA MODIS-aqua satellite part 1-α9 .0
by Dara Shayda
Wolfram Community, STAFF PICKS, February 18, 2026
https://community.wolfram.com/groups/-/m/t/3641306
by Dara Shayda
Wolfram Community, STAFF PICKS, February 18, 2026
https://community.wolfram.com/groups/-/m/t/3641306