Vostok - Revision of the EPICA Dome C CO2 record from 800 to 600 kyr BPNOAA Paleoclimatology ProgramNational Centers for Environmental Information (NCEI)(fully coded)
Dara O Shayda
dara@compclassnotes.com
dara@compclassnotes.com
In[]:=
DateObject[]
Out[]=
Abstract
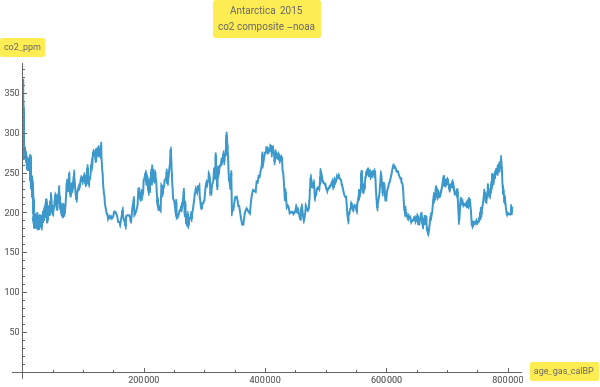
This live code notebook acquires the revised data from the European Project for Ice Coring in Antarctica Dome ice core from Dome C (EDC) has allowed for the reconstruction of atmospheric CO2 concentrations for the last 800,000 years. Here we revisit the oldest part of the EDC CO2 record using different air extraction methods and sections of the core. For our established cracker system, we found an analytical artifact, which increases over the deepest 200 m and reaches 10.1 +/- 2.4 ppm in the oldest/deepest part. The governing mechanism is not yet fully understood, but it is related to insufficient gas extraction in combination with ice relaxation during storage and ice structure. The corrected record presented here resolves partly - but not completely - the issue with a different correlation between CO2 and Antarctic temperatures found in this oldest part of the records. In addition, we provide here an update of 800,000 years atmospheric CO2 history including recent studies covering the last glacial cycle. [1]

© 2012-Present CCN StudiosCreative Commons Attribution-NonCommercial-ShareAlike 4.0

Composite built
Composite built from the following [1]: -51-1800 yr BP: Law Dome (Rubino et al. 2013)1.8-2 kyr BP: Law Dome (MacFarling Meure et al. 2006; https://doi.org/10.25921/g6kd-k189)2-11 kyr BP: Dome C (Monnin et al. 2001 + 2004; https://doi.org/10.25921/ggj5-vt17, https://doi.org/10.25921/aktb-0t39)11-22 kyr BP: WAIS (Marcott et al. 2014) minus 4 ppmv (see text)22-40 kyr BP: Siple Dome (Ahn et al. 2014)40-60 kyr BP: TALDICE (Bereiter et al. 2012; https://doi.org/10.25921/4vks-ex31)60-115 kyr BP: EDML (Bereiter et al. 2012; https://doi.org/10.25921/4vks-ex31)105-155 kyr BP: Dome C Sublimation (Schneider et al. 2013)155-393 kyr BP: Vostok (Petit et al. 1999; https://doi.org/10.25921/kcry-ae86)393-611 kyr BP: Dome C (Siegenthaler et al. 2005)612-800 kyr BP: Dome C (Bereiter et al. 2014)
Data Source
Contribution DateDate: 2015-02-04Last Modified DateDate: 2024-08-16age_gas_calBP gas age, calendar year before presentco2_ppm carbon dioxide, parts per millionco2_1s_ppm one standard deviation
In[]:=
url="https://www.ncei.noaa.gov/pub/data/paleo/icecore/antarctica/antarctica2015co2composite-noaa.txt";datavos0=Import[url,"Table"];
In[]:=
datavos0[[143]]
Out[]=
{age_gas_calBP,co2_ppm,co2_1s_ppm}
All comments and text are removed from the top of the data file:
In[]:=
data=ToExpression@Drop[datavos0,143];
In[]:=
data[[1]]
Out[]=
{-51.03,368.02,0.06}
Unscaled plot along x-axis:
In[]:=
ListLinePlot[data[[All,2]]]
Out[]=
In[]:=
ListLinePlot[data[[All,{1,2}]],ImageSize->600,AxesLabel->{Highlighted@"age_gas_calBP",Highlighted@"co2_ppm"},PlotLabel->Highlighted@"Antarctica 2015\nco2 composite-noaa"]
Out[]=
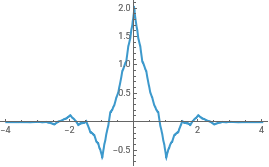
BiorthogonalSplineWavelet [ ]
ϕ
The scaling function satisfies the recursion equation , where are the lowpass filter coefficients.
ϕ(x)
ϕ(x)2ϕ(2x-n)
∑
n
a
n
a
n
In[]:=
Plot[WaveletPhi[BiorthogonalSplineWavelet[2,4],x],{x,-4,4},PlotRangeAll]
Out[]=
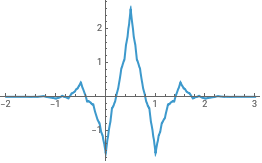
ψ
The wavelet function satisfies the recursion equation , where is the scaling function and are the high-pass filter coefficients. A discrete wavelet transform effectively represents a signal in terms of scaled and translated wavelet functions , where =f(x),ψ(x-n).
ψ(x)
ψ(x)2ϕ(2x-n)
∑
n
b
n
ϕ(x)
b
n
f(x)
f(x)ψ(x-n)
∑
m
∑
n
w
mn
-m/2
2
-m
2
w
mn
-m/2
2
-m
2
In[]:=
Plot[WaveletPsi[BiorthogonalSplineWavelet[2,4],x],{x,-2,3},PlotRangeAll]
Out[]=
In[]:=
WaveletFilterCoefficients[BiorthogonalSplineWavelet[2,4],{"PrimalLowpass","PrimalHighpass"},WorkingPrecision∞]
Out[]=
-4,,-3,-,-2,-,-1,,0,,1,,2,-,3,-,4,,0,-,1,,2,-
3
128
3
64
1
8
19
64
45
64
19
64
1
8
3
64
3
128
1
4
1
2
1
4
StationaryWaveletTransform[ ]
In[]:=
refinements=11;dwd=StationaryWaveletTransform[data[[All,2]],BiorthogonalSplineWavelet[2,4],refinements]
All refinements are indeed the same size:
Decompositions
At each level of the decompositions, the sum of all refinements adds up to the parent:
“EnergyFraction”
Total sum of all EnergyFractions is 1. Think of EnergyFractions as contribution of that decomposed e.g. vector to overall original data.
Decompositions
Total Sum of Decompositions = The Original Data
Exploded View of Decompositions
Exploded View of Refinements
Refinements are levels for decompositions , but they are not decompositions that would sum up to the original data.
In the plot that follows we start with the original data/array { } refinement with color Blue. Then the refinement {0) with color Orange and all the way to the last refinement {0,0,0,0,0,0,0,0,0,0,0} with eleven 1s. See the ticks alongside the y-axis.
In the plot that follows we start with the original data/array { } refinement with color Blue. Then the refinement {0) with color Orange and all the way to the last refinement {0,0,0,0,0,0,0,0,0,0,0} with eleven 1s. See the ticks alongside the y-axis.
Q: Why {0,0,0,0,0,0,0,0,0,0,0} looks flat in this plot?
This is the plot origin and the aspect ratio for the { } refinement which is the entire original data. Notice that this part of the plot has y-axis numbers running roughly between 200 to 350 :
{0,0,0,0,0,0,0,0,0,0,0} not flat!!!
Notice in this plat the y-axis numbers run between 235.655 and 235.569!
A: {0,0,0,0,0,0,0,0,0,0,0} is flat if the origin set at {0, 0}
Now set the AxesOrigin->{0,0} then suddenly this refinement becomes flat! The original plot above with all the refinements stacked along the y-axis (3D) assumes the original is {0,0,0} and the top part of the plots are cut off and rendered and for that matter {0,0,0,0,0,0,0,0,0,0,0} renders flat!
References
[1] Authors: Bereiter, B., S. Eggleston, J. Schmitt, C. Nehrbass-Ahles, T. F. Stocker, H. Fischer, S. Kipfstuhl, J. Chappellaz
Journal_Name: Geophysical Research Letters
Published_Title: Revision of the EPICA Dome C CO2 record from 800 to 600 kyr before present
Published_Date_or_Year: 2015
Volume: 42
Pages: 542-549
Issue: 2
Report_Number:
DOI: 10.1002/2014GL061957
Journal_Name: Geophysical Research Letters
Published_Title: Revision of the EPICA Dome C CO2 record from 800 to 600 kyr before present
Published_Date_or_Year: 2015
Volume: 42
Pages: 542-549
Issue: 2
Report_Number:
DOI: 10.1002/2014GL061957