As soon as countries and tribes formed on earth, wars were started, and battles took place. Thousands of countries rose and fell because of battles. My project aims analyze historical countries and battles. I tried to portray how many different countries change over time and how battles effect them. I searched for a way of analyzing what causes an empire to fall, and what causes one to rise. I also aimed to analyze the regions with the most conflicts.
Introduction
Introduction
Throughout history, the boundaries of countries and empires have been shaped and reshaped by the forces of war, diplomacy, and cultural change. This project leverages a comprehensive dataset that visualizes the rise and fall of borders and countries over the past 2,500 years, paired with a global record of historic military battles. By correlating the timing and locations of battles with the evolution of political borders, this research uncovers patterns in the emergence, expansion, and decline of states and empires.
I started by finding everything I could about the historical battles and countries I was studying. I made datasets that included the dates, the location, and the name of the country or battle. I originally tried to just plot the country using entities but as they did not contain date specific information, I found polygons for the borders of each country every year. To visualize my data, I created functions that would plot battles and countries in any time period or location. I also made many animations that showed countries.
I started by finding everything I could about the historical battles and countries I was studying. I made datasets that included the dates, the location, and the name of the country or battle. I originally tried to just plot the country using entities but as they did not contain date specific information, I found polygons for the borders of each country every year. To visualize my data, I created functions that would plot battles and countries in any time period or location. I also made many animations that showed countries.
Battles
Battles
Overview
Overview
I will be modeling all of the battles in a specific time period and location. First, I will be finding all of the data, which needs to be refined. I created a dataset using the battle data, and then I refined the dates and other information. I also had to filter out data missing information. I needed to find the location of each battle as a coordinate too. Then, I created functions that would filter out the battles that happened at a specified date. Then, I made more filters that would select the location of the battle. Then I was able to plot all battles at any location and time.
Wolfram list of wars
In[]:=
wars=EntityList["MilitaryConflict"];
Finding battles in each war and taking data that isn’t missing
In[]:=
battles1=Flatten[(#1["Battles"]&)/@wars];
terms=Partition[Select[battles1,(MissingQ[#1]≠True&)"Index"],1];
In[]:=
battlesb=Extract[battles1,terms];
In[]:=
Length[battles]
Out[]=
14651
Making a Battle Dataset
Making a Battle Dataset
We want to be able to find which battles happened at a specific time period, so we can make a dataset. First, we need to find the year that each of the battles happened. We can use our entity data to do this. Also, because we want to find where each of these battles happened, we only care about the battles with specific coordinates.
This code converts DateObjects in months/days/years to just dates in years.
In[]:=
startDates=Parallelize[#["StartDate"]&/@battles]
In[]:=
startDateStrings=Parallelize[DateString[#]&/@startDates]
In[]:=
startDateObjects=DateObject[#,"Year"]&/@startDateStrings
This removes all data pieces that don’t have a start date. It also removes data that does not have a location.
In[]:=
posSuccessfulDateObjects=Flatten[Position[DateObjectQ[#]&/@startDateObjects,True]];
newBattles=battles[[posSuccessfulDateObjects]];
In[]:=
location=#[If[MissingQ[#["Position"]],"Coordinates","Position"]]&/@newBattles;
In[]:=
name=#["Name"]&/@newBattles;
In[]:=
newBattleDates=startDateObjects[[posSuccessfulDateObjects]];
This converts all of the data we have found into an association that associates the name, year, and location.
In[]:=
battleData=Table[Association[{"Name"->name[[i]],"Location"->location[[i]],"Year"->newBattleDates[[i]]}],{i,1,Length[name]}];
This code removes all cases in the battleData with a missing location.
In[]:=
cleanedBattleData=DeleteCases[battleData,<|"Name"->__,"Location"->_Missing,"Year"->__|>];
Further Refining the Dataset
Further Refining the Dataset
Although this dataset is good, we still need to make it better. There are many problems with this including the fact that while all of the dates are in years, they still are date objects, which make them extremely difficult to work with. You would have to convert everything to a date object just to compare dates with this. I tried doing it this way but it was far too difficult. I decided to just make them all integers. But, what I didn’t see was that if you convert a date with BC into an integer, you would get an integer with the word BC next to it. We would need to remove this BC to work with the data.
Selects all battles at date with a certain range
In[]:=
battleInTimeQ[date_,difference_]:=Select[cleanedBattleData,Abs[ToExpression[DateString[#["Year"]]]-date]<=difference&]
Converts all of strings with BC into negative numbers
In[]:=
makeNum[s_]:=If[StringContainsQ[DateString@s,"BC"],-1*FromDigits[StringDelete[StringReplace[DateString@s,"BC"->""]," "]],FromDigits[StringDelete[StringReplace[DateString@s,"BC"->""]," "]]]
Makes new dataset using makeNum
In[]:=
battleDataset=Dataset@Table[Association["Name"->cleanedBattleData[[i]]["Name"],"Location"->cleanedBattleData[[i]]["Location"],"Year"->makeNum@DateString[cleanedBattleData[[i]]["Year"]]],{i,9013}];
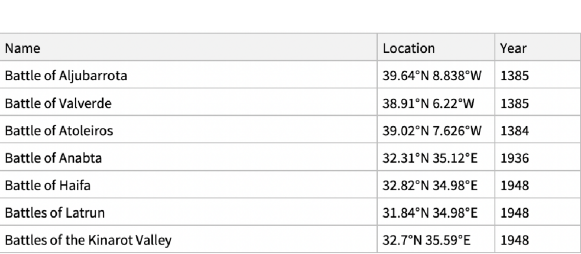
Dataset example
Makes battleDataset a cloud object
In[]:=
battleDatasetCloud=CloudPut[battleDataset,"battleDataset"]
Out[]=
Allows anyone to access
In[]:=
Out[]=
{AllAutomatic,Owner{Read,Write,Execute}}
Selects all of the battles at a certain time with a specified range .
In[]:=
battleInTimeQ[date_, difference_]:=Select[ cleanedBattleData, Abs[ ToExpression[ DateString[#["Year"]]] - date ] <= difference&];
Plots all battles with specified date, continent, and range
In[]:=
timeDiffLocPlot[date_,continentinquotes_,difference_]:=GeoListPlot[Select[battleInTimeQ[date,difference][[All,"Location"]],GeoWithinQ[Entity["GeographicRegion",continentinquotes],#]&]]
Using the Data
Using the Data
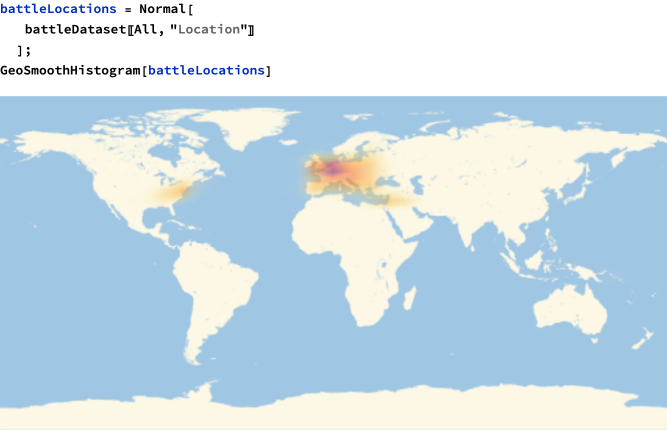
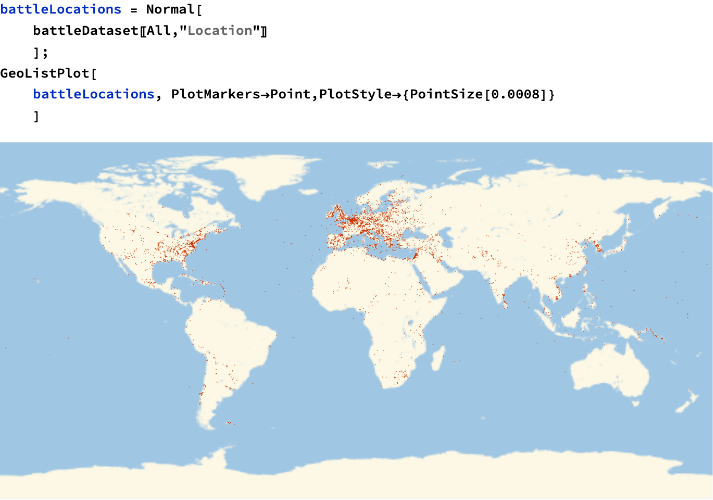
These graphs below are different graphs of all battles in the world .
Creates a smooth graph with battles
Plots the battles
Countries
Countries
Introduction
Introduction
In addition to having all of the data for every battle that has happened, I found data for every country that has ever been documented to have existed on the face of the earth. This is a staggering amount, amounting to thousands, so this data especially took very long to process. This data comes from the Wolfram Knowledgebase using entities. Most of this data is extremely accurate, containing the exact points of each border. Some though, do not have any data at all, so we will need to filter it all out.
Selects all country entities that contain StartDate information :
In[]:=
country1=Select[EntityList["HistoricalCountry"],!MissingQ[#["StartDate"]]&];
Creates a dataset that associates the start date of the country with the end date.
In[]:=
countryDs=Dataset[Table[<|"CountryName"->country1[[i]],"StartDate"->country1[[i]]["StartDate"],"EndDate"->country1[[i]]["EndDate"]|>,{i,Length[country1]}]];
Replaces all missing end-dates with 2025:
In[]:=
countryDs2=Dataset[Replace[Normal@countryDs,_Missing->DateObject[{2025}],{2}]];
Selects only countries that have polygon data:
In[]:=
countryDataset=Select[countryDs2,#["CountryName"]["HasPolygon"]&];
Gets list of all country names in filtered dataset:
In[]:=
countryList=Normal[countryDataset[[All,"CountryName"]]];
Dates in my dataset are very difficult to operate on, because they are DateObjects and some are in years and some are in days or months. So here I have made a function that will convert these values into integers that stand for the year. The dates with BC will be converted to negative numbers.
Function to extract only years from date data and properly format B.C. dates:
Function to extract only years from date data and properly format B.C. dates:
In[]:=
makeNum[s_]:=If[StringContainsQ[DateString@s,"BC"],-1*FromDigits[StringDelete[StringReplace[DateString[s,"Year"],"BC"->""]," "]],FromDigits[StringDelete[StringReplace[DateString[s,"Year"],"BC"->""]," "]]];
Creates new dataset by applying makeNum onto all date properties from previous dataset:
In[]:=
countryDataset2=Dataset@Table[Association["CountryName"->countryList[[i]],"StartDate"->makeNum@countryDataset[i,"StartDate"],"EndDate"->makeNum@countryDataset[i,"EndDate"]],{i,Length[countryList]}];
This is an example of some of the dataset.
Out[]=
Helper Functions
Helper Functions
Uploading countryDataset2 to cloud
CloudPut[countryDataset2,"countryDataset2"]
Allows anyone to access data
In[]:=
Out[]=
{AllAutomatic,Owner{Read,Write,Execute}}
Selects all countries in a time period
In[]:=
findCountries[date_]:=countryList[[#]]&/@Select[Range[986],countryDataset2[#,"StartDate"]<=date<=countryDataset2[#,"EndDate"]&]
Makes list of polygons for a country
countryPolygon[entity_]:=Table[Dated[entity,i]["Polygon"],{i,Normal@Select[countryDataset2Cloud,#CountryName==entity&][[1]]["StartDate"],Normal@Select[countryDataset2Cloud,#CountryName==entity&][[1]]["EndDate"]}]
Battles and Countries
Battles and Countries
Introduction
Introduction
After getting functions that find the battles at a certain location and time and functions that do the same with countries, we are now ready to combine these functions in order to see what happens.
Plots every battle and country at date and continent with a range.
battlesAndCountriesPlot[date_,difference_,continentinquotes_]:=GeoListPlot[Join[timeDiffLocPlot[date,difference,continentinquotes],finalCountry[date,continentinquotes]]]
Roman Empire
Roman Empire
Overview
Overview
After getting all of the data for battles and countries around the world, I decided to use the data to plot how the Roman Empire expanded and then contracted in its lifetime. I plotted all of the battles that happened at that time along with the changes of the Roman border in a large animation. In order to make a better animation, I thought of the entire Roman Empire as the Roman Kingdom, the Roman Empire, the Roman Republic, the Western Roman Empire, and the Byzantine Empire. I found the Roman country data using functions in the Country section.
Associates the year with the Roman Territory at that year
romanEmpireAssociation=DeleteMissingAssociationThreadJoinRangeNormal@SelectcountryDataset2,#CountryName==&[[1]]["StartDate"],Normal@SelectcountryDataset2,#CountryName==&[[1]]["EndDate"],RangeNormal@SelectcountryDataset2,#CountryName==&[[1]]["StartDate"],Normal@SelectcountryDataset2,#CountryName==&[[1]]["EndDate"],RangeNormal@SelectcountryDataset2,#CountryName==&[[1]]["StartDate"],Normal@SelectcountryDataset2,#CountryName==&[[1]]["EndDate"],RangeNormal@SelectcountryDataset2,#CountryName==&[[1]]["StartDate"],Normal@SelectcountryDataset2,#CountryName==&[[1]]["EndDate"],RangeNormal@SelectcountryDataset2,#CountryName==&[[1]]["StartDate"],Normal@SelectcountryDataset2,#CountryName==&[[1]]["EndDate"]->FlattencountryPolygon,countryPolygon,countryPolygon,countryPolygon,countryPolygon;
In[]:=
CloudPut[romanEmpireAssociation,"romanEmpireAssociation"]
Out[]=
In[]:=
SetPermissions[CloudObject[
https://www.wolframcloud.com/obj/james48/romanEmpireAssociation
],"Public"]Out[]=
{AllAutomatic,Owner{Read,Write,Execute}}
Finds all battles during Roman Empire
Finds all battles during Roman Empire
romanBattleInTimeQ[date_]:=Select[ battleData, Abs[ ToExpression[ DateString[#["Year"]]] - date ] <= 100&];
Creates the animation and exports to cloud.
In[]:=
CloudExportListAnimateParallelizeTableGeoListPlotFlatten[{#[i]&/@romanEmpireAssociation,romanBattleInTimeQ[i]}],GeoRange->GeoBoundingBox,{i,-753,1453},"GIF"
Convert the animation to a gif to save space.
In[]:=
In[]:=
framesa=Import[CloudObject[
https://www.wolframcloud.com/obj/14de6733-ac6e-4035-883d-ee790ebd0014
]];framesb=Table[ImageTrim[framesa[[i]],{{25,100},{780,500}}],{i,9,30}]ListAnimate[framesb,DefaultDuration->10]Out[]=
German and France Visualizations
German and France Visualizations
Overview
Overview
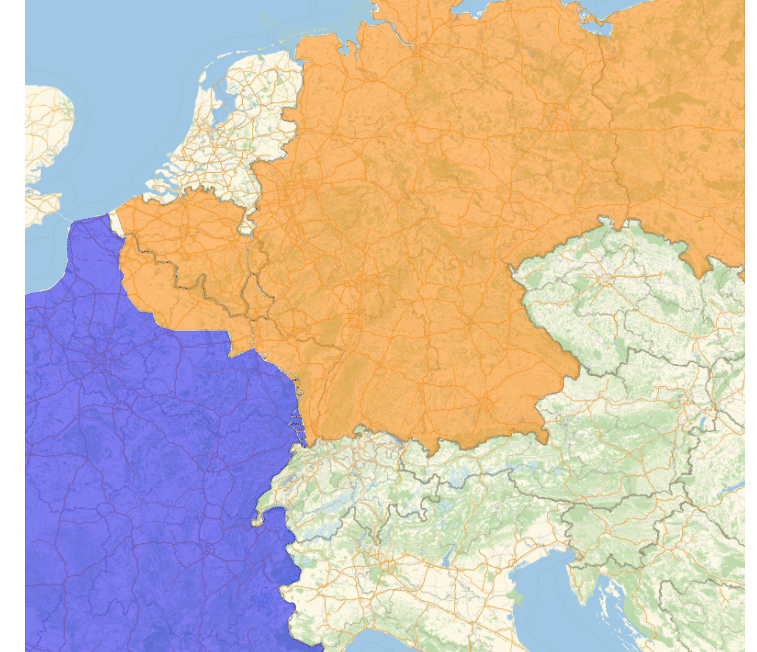
I have also made visualizations of Germany and France from the end of the Napoleonic era to the end of World War 1. First, I found which German and French countries existed during this time period. Then, I found data about them.
Making associations with an association of the date to the countrypolygon
Data found using other wolfram functions
Data found using other wolfram functions
germanempire=AssociationThreadRange[1871,1918]->TableDated,i["Polygon"],{i,1871,1918};germanconfederation=AssociationThreadRange[1815,1866]->TableDated,i["Polygon"],{i,1815,1866};$Abortednorthgermanconfederation=AssociationThreadRange[1866,1871]->TableDated,i["Polygon"],{i,1866,1871};frenchthirdrepublic=AssociationThreadRange[1870,1918]->TableDated,i["Polygon"],{i,1870,1918};secondfrenchempire=AssociationThreadRange[1852,1870]->TableDated,i["Polygon"],{i,1852,1870};frenchsecondrepublic=AssociationThreadRange[1848,1852]->TableDated,i["Polygon"],{i,1848,1852};kingdomofthefrench=AssociationThreadRange[1830,1848]->TableDated,i["Polygon"],{i,1830,1848};frenchbourbonrestoration=AssociationThreadRange[1815,1830]->TableDated,i["Polygon"],{i,1815,1830};
Animation converted to a gif to save space
Animation converted to a gif to save space
ListAnimateTableGeoListPlot{Flatten[DeleteMissing[#[[Key[year]]]&/@{germanempire,germanconfederation,northgermanconfederation}]],Flatten[DeleteMissing[#[[Key[year]]]&/@{frenchthirdrepublic,secondfrenchempire,frenchsecondrepublic,kingdomofthefrench,frenchbourbonrestoration}]]},GeoRange->GeoBoundingBox,,PlotStyle{Orange,Blue},PlotLegends->None,{year,1816,1917}
Out[]=
In[]:=
framesA=Import[CloudObject[
https://www.wolframcloud.com/obj/788b6e95-3b53-486a-ba3f-9fadc4237abd
]]In[]:=
framesB=Table[ImageTrim[framesA[[i]],{{25,100},{780,750}}],{i,7,22}]
In[]:=
ListAnimate[framesB,DefaultDuration->5]
Out[]=
Conclusion
Conclusion
This project been a success in analyzing historical countries and their respective battles that they have fought. I think that the analysis of these battles and countries has provided many interesting visualizations and conclusions. For instance, the area with the most conflicts throughout history has been Northern Europe by far. I have created animations of the Roman Empire, a profound example of how countries always will fall. But because of its great size, it took an extremely long time for it to be defeated. Also, during the main extent of the Roman Empire, all battles that were fought were fought against them, but later on, when Rome had fallen and the Byzantine Empire was being defeated, many battles started appearing all over the map in areas not connected to the Byzantines. This shows how once a large country has been defeated, the countries that were weaker will now become more powerful and able to wage war now. This has happened in other times in history like World War 2, where after Germany was defeated, the US and the Soviet Union started to become very aggressive towards each other because they were now the most powerful. All of these analyses have provided very interesting conclusions and I hope to expand upon them.
Future Extensions
Future Extensions
In the future, I will hope to get a more rigid way of finding when countries will fall based on battle and border data. I could create a method of modeling this using mathematical functions that relate these two variables. It could contain information on how large the battle was, if it was a success or defeat, or if it was inside the country’s borders. I could also create a neural network that predicts how long it will take for the country to fall based on this data. Now that I have all of this data, in the future I can implement these ideas.
Acknowledgements
Acknowledgements
Thank you to my mentor, Zoya, for her help in helping me code and think of ideas that I could use for my project. She was a very big help. Also thank you to Sanay for his consistent help with coding. I owe a lot to him. Also thank you to Ritvik for helping make my code more efficient. Also I’d like to thank Stephan Wolfram for helping me chose my topic and to the WSRP staff. Also to Logan for his help.