Started reading Bruce Schneier’s “Data and Goliath’s” Book, which made me wonder on the potential of mass surveillance. Let’s tests some concepts of what can be done by the metadata generated by the smartphone, using the Wolfram Data Drop announced by Stephen Wolfram this march on the wolfram blog.
There is a neat application called Tasker, which allows for the automation of scripts (tasks) on the android phone, triggered by events, time or phone state changes. In this example, we’ll simulate the “It’s just metadata” approach by capturing some phone variables and pushing the values into the new DataDrop Universal accumulator via the web api.
Here is the how-to recipe to establish a data push to the databin every two minutes.
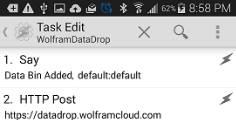
Task Creation. Created a task called WolframDataDrop, which contains two actions. The first action:Say was placed there for debugging purposes. It will announce that data will be pushed to the cloud. The HTTP Post is the actual action that uses the Web API to accumulate the data points into the Databin.
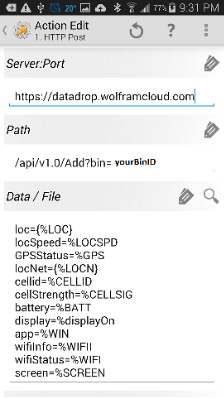
HTTP Post Action. This is the actual WEBAPI Details, the screen capture explains how to set up the different data pieces.
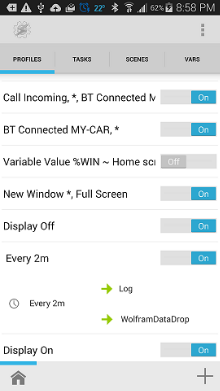
Profile. I’ve generated a profile that will trigger the posting of the variables into the Wolfram Data Drop every two minutes.
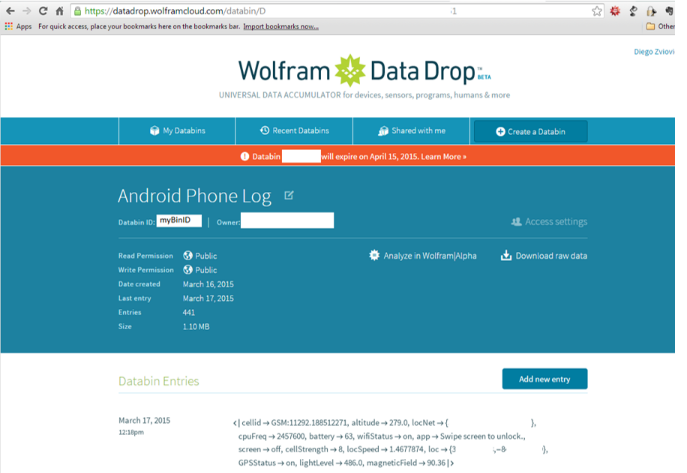
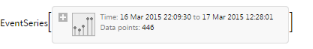
After releasing the profile, we can check if the data is flowing by visiting the databin’s web page.
Now to the Mathematica side of things.
db=Databin["myDataBin"];battery=db["Data"]["battery"]
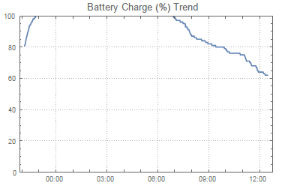
The Tasker HTTP Posting is sending the data in String type, so we need to convert the records to numbers.
battery[[2,1]]=ToExpression[battery[[2,1]]];DateListPlot[battery,PlotRange->{Automatic,{0,100}},PlotLabel->"Battery Charge (%) Trend",PlotTheme->"Detailed"]
We can also see on a map where we’ve been located since we turned on the data log.
geoData=db["Data"]["loc"];geoData[[2,1]]=GeoPosition[ToExpression[#]]&/@geoData[[2,1]];GeoGraphics[{Darker@Green,PointSize[Large],Point[geoData[[2,1]]]},ImageSize->Large]
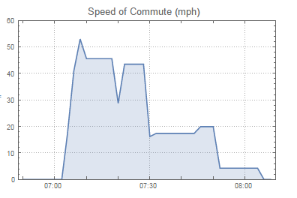
What about speeding during the commute? Let’s take the GPS Speed variable and chart this morning’s travel. The pnone captures the speed in meters/second. Let’s chart using miles per hour.
locSpeed=TimeSeries[db["Data"]["locSpeed"]];locSpeed[[2,1]]=UnitConvert[Quantity[ToExpression[locSpeed[[2,1]]],"m/s"],"mph"];DateListPlot[TimeSeriesWindow[locSpeed,{{2015,03,17,06,50},2015,03,17,08,10}}],Filling->Axis,PlotRange->{Automatic,{0,60}},PlotLabel->"Speed of Commute (mph)",PlotTheme->"Detailed"]