This project investigates the geometric structure of the rule space of one-dimensional cellular automata with three states (K = 3) and radius 1. Using a fixed base rule, we explore how 1-bit, 2-bit, and 3-bit mutations affect the spatial-temporal evolution of the system.
By visualizing evolutions, computing distance metrics, extracting structural and visual features, and constructing graph representations of local rule neighborhoods, we aim to uncover underlying patterns, clusters, and transitions in behaviour. The overall goal is to better understand the shape and topology of multi-state CA rule space using a computational and geometric lens.
By visualizing evolutions, computing distance metrics, extracting structural and visual features, and constructing graph representations of local rule neighborhoods, we aim to uncover underlying patterns, clusters, and transitions in behaviour. The overall goal is to better understand the shape and topology of multi-state CA rule space using a computational and geometric lens.
Introduction
Introduction
Cellular automata (CAs) are discrete computational systems that evolve in time based on a set of local update rules. Despite their simplicity, they are known to produce an astonishing variety of complex, emergent and sometimes chaotic behaviors. These systems have been widely studied in the binary case (two states), but the structure and dynamics of multi-state cellular automata remain comparatively under-explored.
At the core of any cellular automaton is its rule, which defines how local configurations evolve. When we consider all possible rules under a fixed number of states and neighborhood size, we obtain what is known as the rule space, a structured space where each point corresponds to a different automaton.
At the core of any cellular automaton is its rule, which defines how local configurations evolve. When we consider all possible rules under a fixed number of states and neighborhood size, we obtain what is known as the rule space, a structured space where each point corresponds to a different automaton.
This project focuses on mapping the rule space of one-dimensional cellular automata with two states, as well as a subset of three-state rules, and we project these rules onto a feature space that captures the key characteristics of their corresponding cellular automaton evolutions. To do this, we started from a fixed rule, and investigate how small mutations, defined as changes to one, two, or three digits on the rule, affect the automaton’s behavior.
By doing this, we aim to gain insights into the structure and geometry of rule space, identifying clusters of similar behavior and regions of increased complexity. Understanding these structures can support future research in complexity theory, algorithmic generation, and rule classification.
By doing this, we aim to gain insights into the structure and geometry of rule space, identifying clusters of similar behavior and regions of increased complexity. Understanding these structures can support future research in complexity theory, algorithmic generation, and rule classification.
Preliminary Analysis With 2-state Cellular Automata
Preliminary Analysis With 2-state Cellular Automata
Before investigating the more complex 3-color rule space, we first explored the full space of binary (2-color) radius-1 cellular automata. This allowed us to compare all 256 possible rules and visualize the structure of the rule space through mutation graphs, Hamming distance, and feature-based clustering of the cellular automata evolutions:
In[]:=
twoColorRules=Tuples[{0,1},8];twoColorRuleNumber=FromDigits[#,2]&/@twoColorRules;twoColorEvolution=CellularAutomaton[{#,2,1},ReplacePart[ConstantArray[0,200],100->1],100(*time*)]&/@twoColorRuleNumber;twoColorevolutionPlot=ArrayPlot[#]&/@twoColorEvolution;
1-Bit mutation
1-Bit mutation
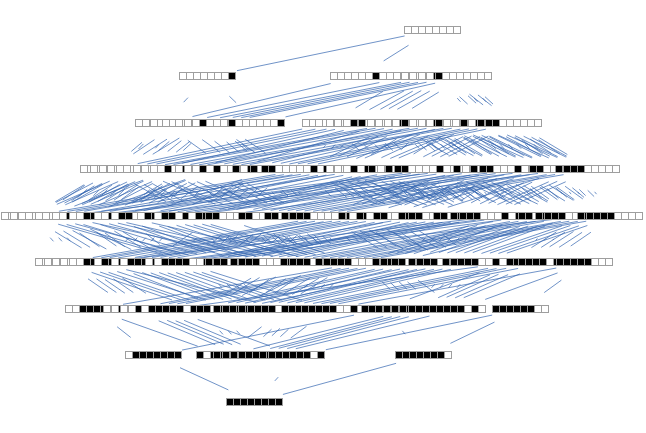
One particularly insightful visualization came from constructing a mutation graph of all 256 binary rules. By connecting each rule to others that differ by a single bit, each vertex was visually represented by the binary vector of the rule, allowing for immediate recognition of patterns across mutation neighborhoods:
Out[]=
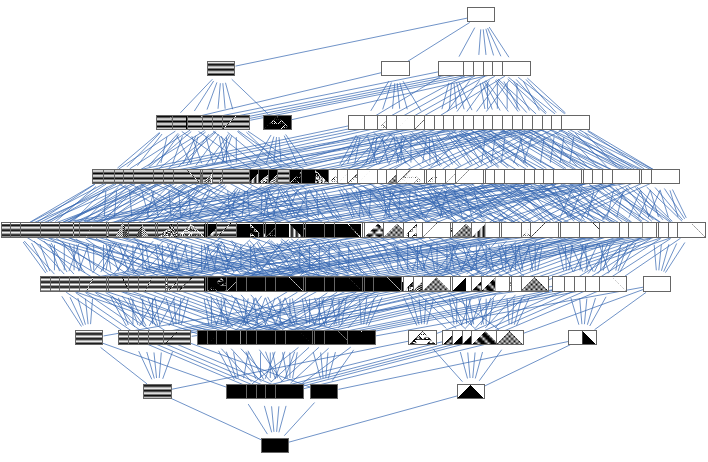
We can also see this same plot but for the evolutions of each rule:
Out[]=
We can observe the Hamming distance for this 1-bit mutation effect on the cellular automata evolution:
Out[]=
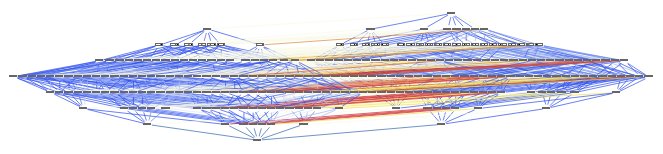
In here the red color means a bigger effect of a 1-bit mutation on the rule, while blue means a small or null effect of a 1-bit mutation on the rule.
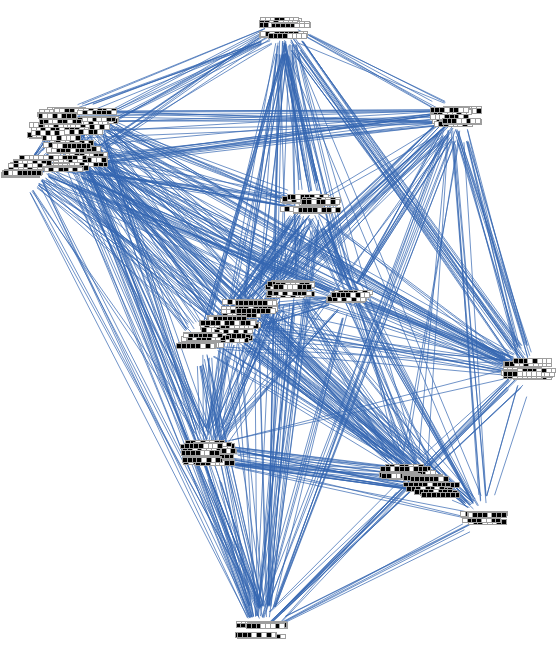
To further analyze behavioral similarity among the 256 binary rules, we used FeatureSpacePlot to embed their spatiotemporal evolutions into a low-dimensional space. Each evolution was automatically processed into a numerical feature vector, capturing statistical and structural properties of its dynamics.
Out[]=
Using these coordinates, we constructed a custom graph visualization, where each vertex corresponds to a rule positioned according to its feature-based embedding. Each node displays the rule vector as a small ArrayPlot, and hovering reveals the full evolution. This combined geometric and graphical view illustrates how rules with very different underlying structures can still fall into the same behavioral cluster—highlighting the power of feature-based representations in mapping the landscape of cellular automata.
Out[]=
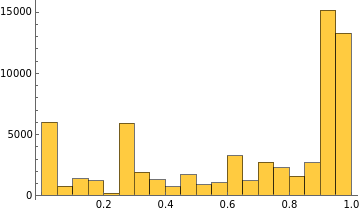
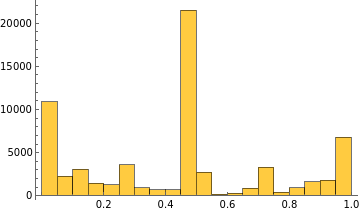
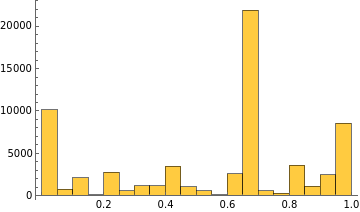
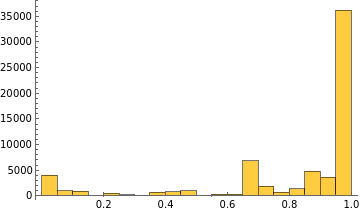
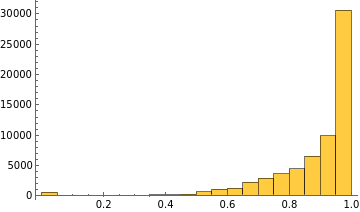
To analyze what is happening, we examined various distance measures. One notable pattern we observed is that most of the variation tends to cluster around three regions: near zero, approximately 50%, or close to 100%.
Out[]=
,
,
,
,
,
,
,
,
,
,
,
,
,
,
2-Bit mutation
2-Bit mutation
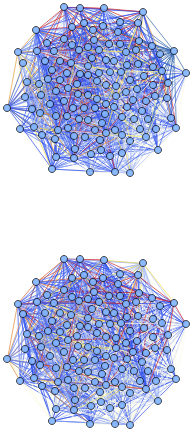
To further explore the structure of the 2-color rule space, we constructed a 2-mutation graph of all 256 binary rules, connecting rules that differ by a single bit in their rule vectors, the graph presents a clear view of how rules are organized based on structural proximity. Again, the edges are colored according to the Hamming distance between the evolutions of the connected rules, revealing striking insights: even structurally similar rules can produce drastically different behaviors.
Out[]=
And the hamming distance now variates less
Out[]=
3-Bit mutation
3-Bit mutation
Out[]=

Out[]=
The Rule Space of 3-State Cellular Automata
The Rule Space of 3-State Cellular Automata
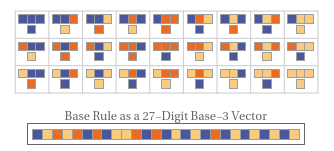
In a 3-state, radius-1 CA, each cell updates based on its own state and the state of its two immediate neighbors. This results in 3³ = 27 possible neighborhood configurations, and each one maps to an output value in {0, 1, 2}.
Therefore, each rule can be uniquely represented as a 27-digit number in base 3 — a vector in a 27-dimensional discrete space.
Therefore, each rule can be uniquely represented as a 27-digit number in base 3 — a vector in a 27-dimensional discrete space.
Out[]=
This means that the total number of rules in this space is , an astronomically large number. We are therefore limited to exploring local neighborhoods within this space, defined by small mutations to a given base rule. Each rule can be considered a vertex in a 27-dimensional discrete cube (or hyper-grid), where adjacent vertices differ by a single digit.
(5424354387780 in base 10, or its base-3 digit expansion)
27
3
(5424354387780 in base 10, or its base-3 digit expansion)
Out[]=
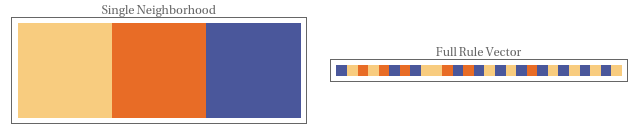
A 1-bit mutation corresponds to changing a single digit in the base-3 representation of the rule. Since each digit has 2 alternatives (excluding its current value), there are exactly
27×2=54 possible 1-bit mutations per rule.
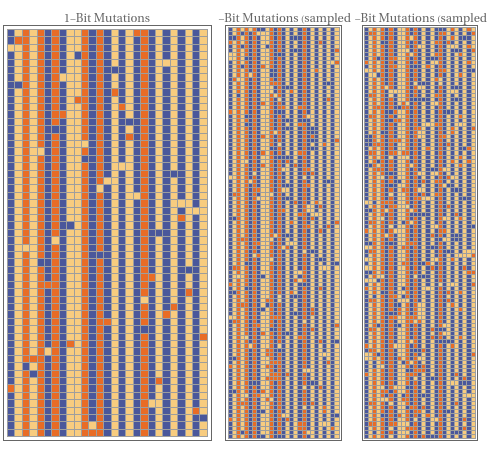
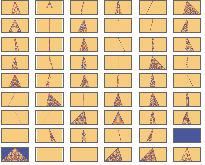
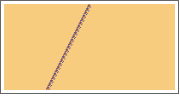
We define a local neighborhood of a rule as the set of rules reachable via small mutations. A 1-bit mutation alters one digit in the base-3 rule vector, producing 54 immediate neighbors. For 2-bit and 3-bit mutations, we sample a limited number of cases due to the combinatorial explosion in possibilities.
Below we show visual representations of these mutated rule vectors, where each row corresponds to a new rule:
27×2=54 possible 1-bit mutations per rule.
We define a local neighborhood of a rule as the set of rules reachable via small mutations. A 1-bit mutation alters one digit in the base-3 rule vector, producing 54 immediate neighbors. For 2-bit and 3-bit mutations, we sample a limited number of cases due to the combinatorial explosion in possibilities.
Below we show visual representations of these mutated rule vectors, where each row corresponds to a new rule:
Out[]=
Cellular Automata Evolution
Cellular Automata Evolution
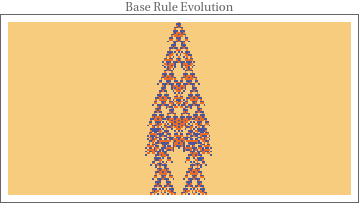
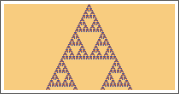
To study the dynamics of each rule, we simulate the evolution of a one-dimensional cellular automaton for 100 time steps. The initial condition is a length-200 vector with a single nonzero value (1) at the center.
This creates a controlled environment where the effects of each rule become visible from a standardized seed.
This creates a controlled environment where the effects of each rule become visible from a standardized seed.
Out[]=
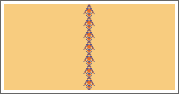
For each 1-bit, 2-bit, and 3-bit mutated rule, we simulate the same initial condition and collect the resulting evolution patterns. This allows us to observe how small changes in the rule vector affect the system’s global dynamics.
Out[]=
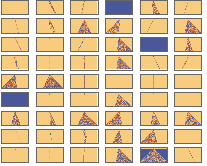
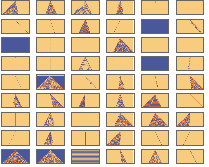
Through this step, we build an intuition for how the rule space translates into dynamic behavior. In the next sections, we formalize this comparison using distance metrics and feature extraction techniques.
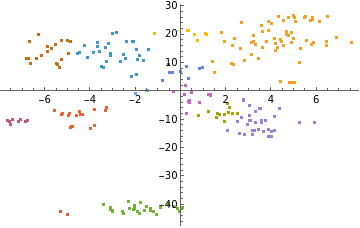
We generated a FeatureSpacePlot, embedding all mutated behaviors into a shared feature space. Each point in the plot corresponds to a rule’s evolution, allowing us to visually compare and distinguish between behavior types.
Out[]=
Extract the coordinates plots
In[]:=
coordinatesofplot=Cases[plot,Point[pt_]:>pt,All];
Clustering
Clustering
Finding Clusters for all mutations until the 3bits
Out[]=
Out[]=
,
,
0.443137 |
0.231373 |
0.32549 |
Metrics and Feature Extraction
Metrics and Feature Extraction
To compare the behaviors of mutated rules in a systematic way, we use a combination of distance metrics and feature extraction techniques. This allows us to move from visual comparison to quantitative analysis, and to explore the structure of rule space based on the phenomenology of their evolutions.
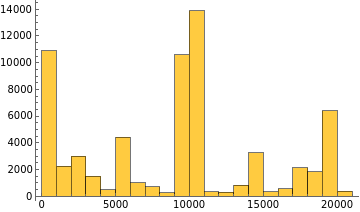
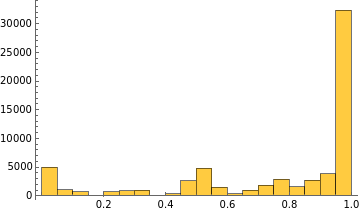
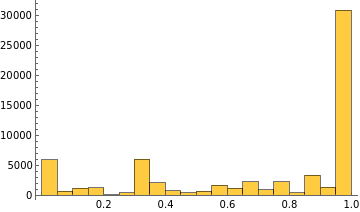
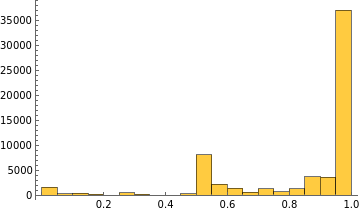
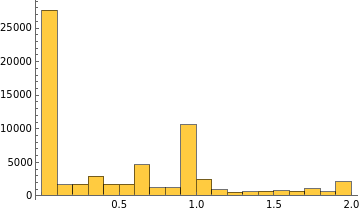
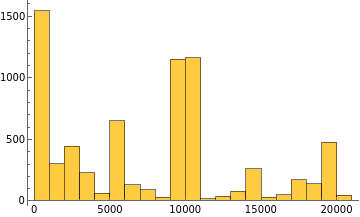
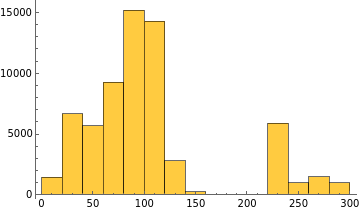
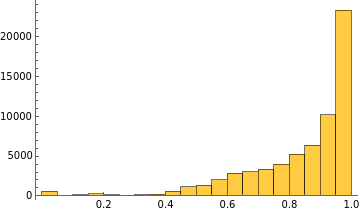
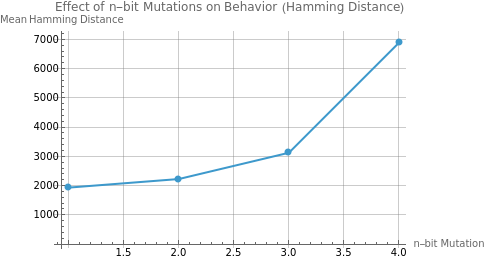
To analyze how rule mutations affect behavior, we computed Hamming, Euclidean, and Chessboard distances between the evolutions of 1-bit, 2-bit, and 3-bit mutated rules. As expected, larger mutations tend to produce greater differences, especially in the Hamming and Euclidean metrics. The Hamming distance shows a bimodal distribution for 3-bit mutations, suggesting both minor and major behavioral shifts.
Out[]=
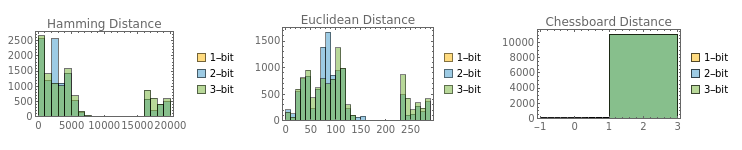
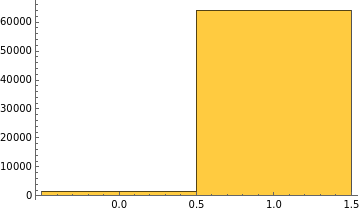
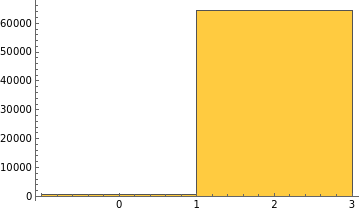
This collection of histograms shows how different distance metrics capture variation in the space-time evolutions of n-bit mutated rules(until 3-bits). While metrics like Hamming, Manhattan, and Euclidean exhibit broad distributions, indicating a wide range of behavioral divergence, the Chessboard distance, in contrast, saturates at specific value, suggesting limited discriminative power in this context.
Out[]=
,
,
,
,
,
Here we can see the average of the Hamming Distance of each n-bit mutation for the cellular automata
Out[]=
Future Work
Future Work
We plan to extend this approach to larger-scale explorations of rule space, including evolutionary trajectories and multiway graphs of mutational histories. These tools may reveal long range topological features or a deeper quantitative characterization of complexity. Building and analyzing multiway graphs of mutational trajectories could reveal deeper structural and behavioral patterns.
Future investigations may incorporate absolute complexity measures such as Shannon entropy, lossless compressibility, or approximations to algorithmic complexity.These metrics could help classify rules along a spectrum from trivial to chaotic or computationally rich.
The same geometric and graph-based framework developed here could be applied to other systems, such as image transformations, string rewrite systems, or neural network architectures, where rules or models can be encoded and compared.
Concluding Remarks
Concluding Remarks
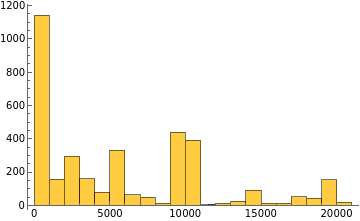
Our analysis focused on understanding how small mutations in a base rule affect system behavior and how this behavior is distributed geometrically. To quantify these effects, we computed multiple distance metrics between the evolutions, including Hamming, Cosine, and Euclidean distances. Histograms of these distances revealed a broad spectrum of behavioral divergence, especially for 2- and 3-bit mutations. Notably, some 1-bit mutations already exhibited extremely high Hamming distances, flipping over 20,000 of 20,200 total cells across the evolution grid, highlighting the system’s inherent sensitivity to small perturbations.
By extracting the coordinates from the feature space, we applied clustering algorithms to formally group similar behaviors. These clusters were then visualized, showing clear separations between classes of rules. This approach confirmed that rules with different structural distances can still belong to the same behavioral group, and vice versa.
Together, these results demonstrate that the rule space is highly non-linear and rich in structure: close rules can behave very differently, and distant rules can behave similarly. This reinforces the utility of feature-based analysis to uncover meaningful organization in the otherwise vast and chaotic landscape of cellular automata.
Acknowledgments
Acknowledgments
I would like to express gratitude to my mentors Alejandra Ortiz, Eric Parfitt and also Stephen Wolfram for their guidance, insights and ideas for the project. I am thankful to the research teams at iLIKA-UFPE and IRRD-UFRPE, particularly the students involved in our scientific initiation group: Rebeca Vitória, Lívia Maria, Lucas Gabriel, Leon Lourenço and Vithória Camila, whose discussions and enthusiasm helped shape the foundations of many of my ideas. A special thanks goes to Rebeca Vitoria for her constant support, collaboration and patnership in life. I am also thankful to my research coordinators, Jones Albuquerque and Silvana Bocanegra, for their continued trust and academic support and for introducing me to the wolrd of cellular automata. Finally, I am deeply grateful to my mother, whose unwavering encouragement and belief in my academic journey have been essential to everything I pursue.
References
References
1
.S. Wolfram (2002), A New Kind of Science. Wolfram Media.
2
.J. Schiff(2008), Cellular Automata: A Discrete View of the World. Wiley-Interscience.
Cite This Notebook
Cite This Notebook
Investigating rule space geometry on multi-state cellular automata
by Davi Vieira da Silva
Wolfram Community, July 9, 2025
https://community.wolfram.com/groups/-/m/t/3497943
by Davi Vieira da Silva
Wolfram Community, July 9, 2025
https://community.wolfram.com/groups/-/m/t/3497943