With the advancement in technology, It has become a game changer in finance industry. Most of the data is readily available on the net. An Interactive Interface which gives real-time information about stocks in an intuitive format can be helpful for the users. The Idea of this project is to collect stock related data from websites and present the data in an interactive format.This app will be useful for visualisation and understanding the financial data better. The method discussed here will be useful to collect any live data and visualize it in Wolfram language. A few interesting cases where this method can be useful are analysing cryptocurrency, race (Tour De France/Marathon etc) and competition data in real time.
Motivation
Motivation
We will discuss how to collect and use any live data form web in Wolfram Language. Here we will be using India Stock data as an use case since many of the company data are not available in FinancialData Function.
Getting Latest Stock Data from FinancialData
{FinancialData["RELIANCE"], Quiet[FinancialData["SBIN"]], Quiet[FinancialData["NSE:SBIN"]]}
Out[]=
{,Missing[NotAvailable],Missing[NotAvailable]}
Data Collection
Data Collection
In this project, our primary financial data sources are Yahoo! Finance and Google Finance.
We can collect real time data by controlling a web-browsers. Here we will showcase how to collect data from Yahoo! Finance [1]. This process involves using WebExecute and dynamics to automate the part of data collection.
WebSession=StartWebSession["Chrome",{Visible->"DisableImage"}];
Opening Yahoo! Finance Page of SBIN
WebExecute[WebSession,"OpenPage"->"https://finance.yahoo.com/quote/"<>"SBIN"<>".NS?p="<>"SBIN"<>".NS"];
Extracting the WebElements corresponding to the X-Path of Price and Volume, and parting it since it’s inside a list
reqWebElements=(WebExecute[WebSession,"LocateElements"->"XPath"->#][[1]])&/@{"//*[@id=\"quote-header-info\"]/div[3]/div[1]/div/fin-streamer[1]"(*PriceXPath*),"//*[@id=\"quote-summary\"]/div[1]/table/tbody/tr[7]/td[2]/fin-streamer"(*VolumeXPath*)};
Getting the price
rawStockValues=WebExecute[WebSession,"ElementText"->reqWebElements];{price,volume}=ToExpression@StringReplace[#,{","->"","+"->""}]&/@rawStockValues
Out[]=
{510.7,1656064}
Dynamically updating the data
In[]:=
Dynamic[ rawStockValues=WebExecute[WebSession,"ElementText"->reqWebElements]; {price,volume}=ToExpression@StringReplace[#,{","->"","+"->""}]&/@rawStockValues; {DateList[],{price,price,price,price,volume}},UpdateInterval->2,TrackedSymbols->{}]
Out[]=

The current stock price and volume data will be used in TradingChart. Similarly we can get data from Google Finance.
Visualization
Visualization
Main Chart
Main Chart
In the main chart we’ll plot the data received form Yahoo! Finance into a Trading Chart. To plot this we need a list which stores all points we get dynamically. There is already a tutorial on this on wolfram documentation [3]. We’ll plot the list we’re appending our data into and update the chart dynamically. We’ll now create a function which will take a WebSession and a stock-code as arguments and return a TradingChart.
In[]:=
stockMainChart[session_, stockCode_] :=DynamicModule[ {unfilteredElements,stockResult,price,volume,currStockValueMain,mainChartList={}}, WebExecute[session, "OpenPage"->"https://finance.yahoo.com/quote/"<>stockCode<>".NS?p="<>stockCode<>".NS"]; unfilteredElements=(WebExecute[session, "LocateElements"->"XPath"->#][[1]])&/@{"//*[@id=\"quote-header-info\"]/div[3]/div[1]/div/fin-streamer[1]","//*[@id=\"quote-summary\"]/div[1]/table/tbody/tr[7]/td[2]/fin-streamer"}; Dynamic[ stockResult=WebExecute[session,"ElementText"->unfilteredElements]; {price,volume}=ToExpression[StringReplace[#, {","->"","+"->""}]]&/@stockResult; currStockValueMain={DateList[], {price,price,price,price,volume}}; Last[AppendTo[mainChartList,Setting[currStockValueMain]]]; TradingChart[mainChartList, Appearance->"Line", PlotLabel->Style[stockCode <>" Stock Data", "Title", 20], AspectRatio->0.4, PlotTheme->"Marketing"], UpdateInterval->2, TrackedSymbols->{}]]
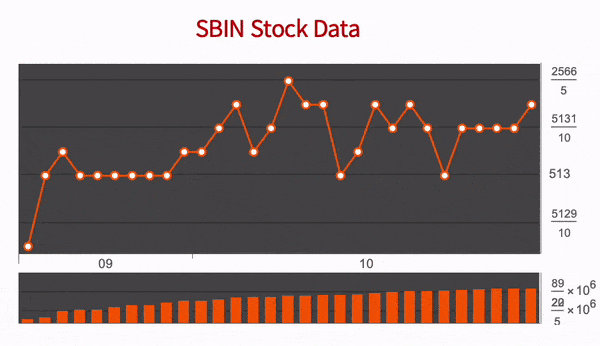
Output of stockMainChart Function
In[]:=
sessionTrial=StartWebSession["Chrome",{Visible->"DisableImage"}];stockMainChart[sessionTrial,"SBIN"]
Out[]=
Mini Chart
Mini Chart
Since, MainChart takes multiple data from Yahoo! Finance, It’s very slow and computationally heavy. Thus we made a fast and lightweight function MiniChart which will help us plot much more faster and will require less computational power.The data is collected from Google Finance since the site is much faster and lighter than Yahoo! Finance.The MiniChart which will only display the DateListPlot of Price of Stock vs Time. Similar to what we did in MainChart, we’ll create a function will take a web session and a stock-code as arguments and return a DateListPlot.
In[]:=
stockMiniChart[session_, stockCode_] :=DynamicModule[ {unfilteredElements,stockResult,currDate,price, currStockValueMini,miniChartList={}}, If[stockCode =="NIFTY_50", WebExecute[session, "OpenPage"->"https://www.google.com/finance/quote/"<>stockCode<>":INDEXNSE"],WebExecute[session, "OpenPage"->"https://www.google.com/finance/quote/"<>stockCode<>":NSE"]]; unfilteredElements=WebExecute[session,"LocateElements"->"XPath"->"//*[@id=\"yDmH0d\"]/c-wiz/div/div[4]/div/div/main/div[2]/div[1]/div[1]/c-wiz/div/div[1]/div"][[1]]; Dynamic[ price=ToExpression@StringReplace[StringSplit[WebExecute[session,"ElementText"->unfilteredElements],"\n"][[1]],{"₹"->"",","->""}]; currStockValueMini={DateList[], price}; Last[AppendTo[miniChartList,Setting[currStockValueMini]]]; DateListPlot[miniChartList, Filling ->Bottom, PlotLabel->Style[stockCode <>" Stock Data", "Subsection", 14], AspectRatio->0.25, PlotTheme->"Marketing"] ,UpdateInterval->4,TrackedSymbols->{}]]
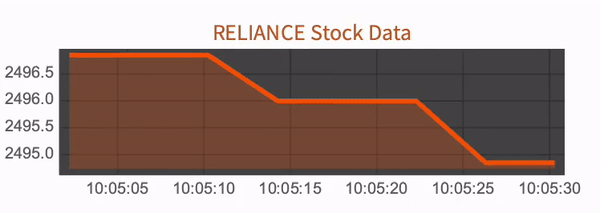
Output of stockMiniChart Function
In[]:=
sessionTrial2=StartWebSession["Chrome",{Visible->"DisableImage"}];stockMiniChart[sessionTrial2,"RELIANCE"]
Out[]=
An Interactive App
An Interactive App
Here we are collecting data from multiple sites from multiple WebSessions simultaneously and dynamically plotting it in Wolfram Language.
We will structure our layout by using Graphics and it’s functionalities. GraphicsGrid gives us the freedom of choosing our layout and also simultaneously showcases multiple different plots.
To use manipulate on a dynamic module, we first need to turn SynchrounousUpdating to False [] so that it doesn’t hinder with dynamics present inside the dynamic module. We also need to wrap the whole GraphicsGrid with Preempt Protect so that the current evaluation is not disturbed by previous evaluations of the manipulate function which may be caused by changing the controls.
In[]:=
sessMain=StartWebSession["Chrome",{Visible->"DisableImage"}];sessMini1=StartWebSession["Chrome",{Visible->"DisableImage"}];sessMini2=StartWebSession["Chrome",{Visible->"DisableImage"}];sessMini3=StartWebSession["Chrome",{Visible->"DisableImage"}];
Manipulate[PreemptProtect[GraphicsGrid[ {stockMainChart[sessMain,MainStock],SpanFromLeft,SpanFromLeft,stockMiniChart[sessMini1,MiniStock1],SpanFromLeft}, {SpanFromAbove,SpanFromBoth,SpanFromBoth,stockMiniChart[sessMini2,MiniStock2],SpanFromLeft}, {SpanFromAbove,SpanFromBoth,SpanFromBoth,stockMiniChart[sessMini3,MiniStock3],SpanFromLeft} ,ImageSize->{1000,500},Frame->All,FrameStyleWhite,Background->Black]], {MainStock,{"RELIANCE","SBIN","TCS","LT"}}, {MiniStock1,{"NIFTY_50","RELIANCE","SBIN","TCS","LT"}}, {MiniStock2,{"SBIN","TCS","LT","RELIANCE"}}, {MiniStock3,{"TCS","LT","RELIANCE","SBIN"}}, SynchronousUpdatingFalse]
Out[]=
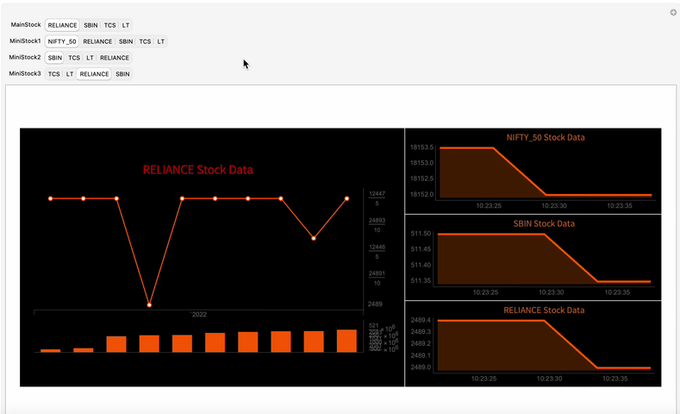
Although the Manipulate works fine, it refreshes every chart even though only values of one the chart is changed. This is likely the consequence of using PreemptProtect which doesn’t let data carry over from previous evaluation of Manipulate.
Concluding remarks
Concluding remarks
We were able to successfully extract real-time data from websites like Yahoo! Finance and Google Finance. We were then able to plot the dynamic data into charts and create an interactive interface to display the stock data. However, there are some issue that the code still faces.
The data used in all the charts are erased even when changes in one control of the manipulate function takes place. This can be improved later. Dynamic Module used to get data from multiple web-sessions can be computationally heavy and creates lags and sometimes even makes the notebook unresponsive. This issue can be improved by parallel processing the dynamic modules of each chart. By Default, the DynamicModule is evaluated sequentially however if the dynamic modules were evaluated in different kernels, which would give faster response time.
The data used in all the charts are erased even when changes in one control of the manipulate function takes place. This can be improved later. Dynamic Module used to get data from multiple web-sessions can be computationally heavy and creates lags and sometimes even makes the notebook unresponsive. This issue can be improved by parallel processing the dynamic modules of each chart. By Default, the DynamicModule is evaluated sequentially however if the dynamic modules were evaluated in different kernels, which would give faster response time.
Keywords
Keywords
◼
Real Time data
◼
Live data plotting
◼
Real Time Financial data
◼
App in Wolfram Language
Acknowledgment
Acknowledgment
I would like to thank my Mentor Suman Banerjee for suggesting me this project and guiding me throughout my project.
I would also like to thank Kevin Daily and M. Bahrami for their valuable input for dynamic data presentation.
Thanks to Tuseeta Banerjee for helping me during the initial stages of the school
Thanks also to the Wolfram India School team for their support.
I would also like to thank Kevin Daily and M. Bahrami for their valuable input for dynamic data presentation.
Thanks to Tuseeta Banerjee for helping me during the initial stages of the school
Thanks also to the Wolfram India School team for their support.
References
References
◼
1. Yahoo! Finance [Data Source]
◼
2. Google Finance [Data Source]