Introduction
Introduction
I have noticed that bitcoin price has just roughly reached the price of 1kg of gold, again, after a long time. One can easily verify this at Wolfram Alpha:
In[]:=
Out[]=
1.021
Or simply checking online:
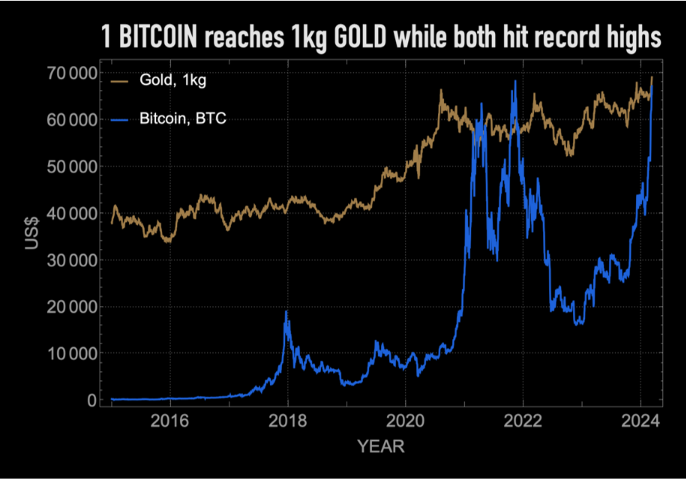
This happened in the past already but just a few times. Coincidentally this happens exactly at the moment when both bitcoin and gold hit record highs.
The price of gold is standardly given for the value of one troy ounce -- an equivalent to roughly 31 grams:
In[]:=
UnitConvert,"Grams"//N
Out[]=
So when the price of gold is listed it is not immediately obvious what value 1kg of gold has, unless one does the unit conversion. Here I will show how easy it is to import data and plot prices for 1kg gold and bitcoin together so the history and various moments are clear.
Financial background
Financial background
SUMMARY: Bitcoin
SUMMARY: Bitcoin
◼
Bitcoin soared past its previous all-time high of $69,000 set in Nov. 2021.
◼
The largest cryptocurrency by market cap gave up some of those gains, retreating as some traders took profits
◼
Supporters say high demand and low supply, alongside the SEC approval of spot bitcoin ETFs, are responsible for the rally.
◼
Skeptics see no change in fundamentals; some analysts say ETFs would add to price volatility.
SUMMARY: Gold
SUMMARY: Gold
◼
The price for spot gold reached a new record high and has surged 5% in the past month.
◼
Rising expectations for interest rate cuts have aided gold’s rise.
◼
Recent economic data have boosted investors’ rate-cut hopes; election uncertainty may provide additional support.
Importing data
Importing data
Start from importing bitcoin (BTC) data valued in US$:
In[]:=
FinancialData["BTC/USD",{2015},Method->"Legacy"]BTCdata=TimeSeries@%
Out[]=
Out[]=
TimeSeries
As I mentioned earlier, imported gold price data is usually given for the value of one troy ounce of gold. It is equivalent of roughly 31 grams. To convert price for 1kg of gold we need to compute the multiplication factor proportionally to masses ratio:
In[]:=
N
Out[]=
32.1507
Hence, the price data for 1kg of gold is obtained as:
In[]:=
FinancialData["XAU/USD",{2015},Method->"Legacy"];MapAtN#&,%,{All,2}GoldData=TimeSeries@%
Out[]=
Out[]=
TimeSeries
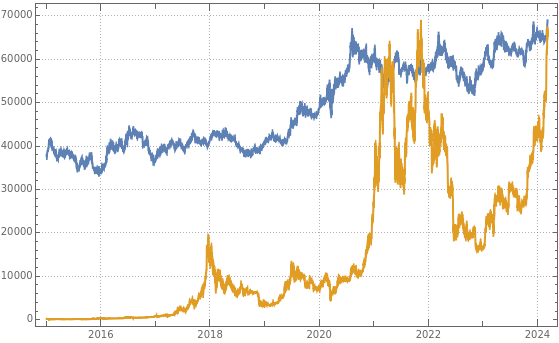
Finally the plot is computed as:
In[]:=
DateListPlot[{GoldData,BTCdata},PlotTheme->"Detailed"]
Out[]=
Alternative data methods: Entity framework and more
Alternative data methods: Entity framework and more
Entity framework is another excellent method to get financial data. Consider this code extracting out gold data in a different way:
In[]:=
Entity["Element","Gold"][Dated[EntityProperty["Element","Price"],DateInterval[{{2015},Today}]]]
Properly formatted it looks compact and nice:
In[]:=
Out[]=
TimeSeries
For bitcoin we can use another alternative method of . It uses exchange rate information provided by for conversion between currency units.
In[]:=
CurrencyConvert["BTC","USDollars",{{2015},Today}]
Out[]=
TimeSeries
Final graphics design
Final graphics design
In[]:=
Framed[DateListPlot[{GoldData,BTCdata},PlotLegends->Placed[Style[#,17]&/@{"Gold, 1kg","Bitcoin, BTC"},{Left,Top}],PlotTheme->"Detailed",BaseStyle->19,FrameLabel->{"YEAR","US$"},ImageSize->700,PlotLabel->Style["1 BITCOIN reaches 1kg GOLD while both hit record highs",35,GrayLevel[.1],FontFamily->"DIN Condensed"]]//Rasterize//ColorNegate,Background->Black,FrameMargins20]
Out[]=
CITE THIS NOTEBOOK
CITE THIS NOTEBOOK
1 Bitcoin reaches 1kg Gold price while both hit record highs
by Vitaliy Kaurov
Wolfram Community, STAFF PICKS, March 7, 2024
https://community.wolfram.com/groups/-/m/t/3137014
by Vitaliy Kaurov
Wolfram Community, STAFF PICKS, March 7, 2024
https://community.wolfram.com/groups/-/m/t/3137014