There are many studies looking into how the COVID-19 virus is spreading in different countries, so I wanted to do something different. We know that the data has problems because of the limited testing and poor quality tests, but there can be bigger problems with the data. Sometimes —specially in communist regimes— people lie and make up numbers and this may leave a trace that sometimes can be detected. One of the tools commonly used to give some lights into the truthfulness of data is the Newcomb Benford Distribution.
The Newcomb Benford Distribution is expected to match well for sets of data with exponential growth and unfortunately this is the case of the COVID-19 data. We will use the curated data built into the Wolfram Language:
ResourceObject["Epidemic Data for Novel Coronavirus COVID-19"]
Out[]=
ResourceObject

From this data we will compare the COVID-19 data for NATO countries vs China. The following selecting functions are used for that:
In[]:=
chinaSelector=#Country==&;
natoSelector=MemberQEntityList,#Country&;

Functions
Functions
For the 1st digit
For the 1st digit
This coronaBenfordPlot function creates our 2nd digit frequencies plot for a given case (“Deaths”, “ConfirmedCases” or “RecoveredCases” ) and a given label and selector:
In[]:=
coronaBenfordPlot[dataCase_,label_,selector_]:=ResourceData[ResourceObject["Epidemic Data for Novel Coronavirus COVID-19"]]//Query[Select[selector]/*Flatten,dataCase,#["Values"]&]//DeleteCases[Missing["NotAvailable"]|0]//Map[IntegerDigits/*First]//Show[Histogram[#,{1},"PDF"],DiscretePlot[PDF[BenfordDistribution[10],x],{x,1,9},PlotStylePointSize[Medium]],FrameTrue,FrameLabel{{"frequency",""},{StringTemplate["1st digit of `` daily `` reports"][Length[#],dataCase],label}}]&
For the 2nd digit
For the 2nd digit
The BenfordDistribution for the 2nd digit is not included in Mathematica. So here we define the PDF for it:
In[]:=
p2NBL[d2_]:=Sum[Log10[1+1/(10j+d2)],{j,9}]
There is a 12% probability that the 2nd digit be zero and a 8.5% probability for it to be 9:
Table[p2NBL[d2],{d2,0,9}]//N
Out[]=
{0.119679,0.11389,0.108821,0.10433,0.100308,0.0966772,0.0933747,0.090352,0.0875701,0.0849974}
This coronaBenfordPlot2 function creates our 2nd digit frequencies plot for a given case (“Deaths”, “ConfirmedCases” or “RecoveredCases” ) and a given label and selector:
In[]:=
coronaBenfordPlot2[dataCase_,label_,selector_]:=ResourceData[ResourceObject["Epidemic Data for Novel Coronavirus COVID-19"]]//Query[Select[selector]/*Flatten,dataCase,#["Values"]&]//DeleteCases[Missing["NotAvailable"]|n_/;n<10]//Map[IntegerDigits/*Extract[{2}]]//Show[Histogram[#,{1},"PDF"],DiscretePlot[p2NBL[d2],{d2,0,9},PlotStylePointSize[Medium]],FrameTrue,FrameLabel{{"frequency",""},{StringTemplate["2nd digit of `` daily `` reports"][Length[#],dataCase],label}}]&
1st Digit
1st Digit
Here we compare the observed 1st digit frequencies vs the Newcomb Benford Distribution prediction.
GraphicsGrid[{{coronaBenfordPlot["Deaths","NATO Countries",natoSelector],coronaBenfordPlot["ConfirmedCases","NATO Countries",natoSelector]},{coronaBenfordPlot["Deaths","China",chinaSelector],coronaBenfordPlot["ConfirmedCases","China",chinaSelector]}},ImageSize600]
Out[]=
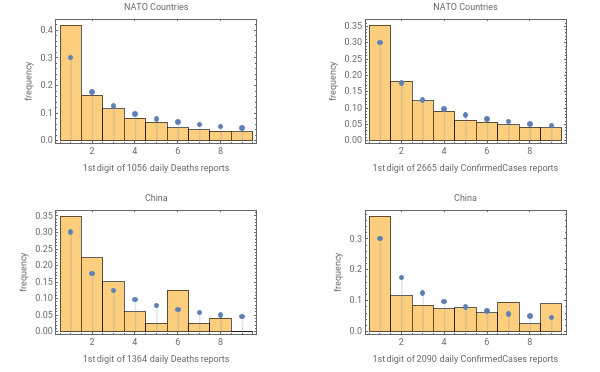
In all cases the influence of the Benford Distribution is evident. The data follows to the Benford Distribution much better for NATO countries than for China. It is interesting that the digit 1 is always overrepresented. Maybe the initial scarcity of test kits creates many days when you just have one confirmed case but this happens also for the death reports for reasons I fail to see. Also, it is strange that only 2 out of 1338 daily China death reports start with the digit 9:
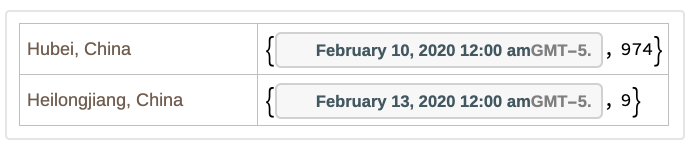
ResourceData[ResourceObject["Epidemic Data for Novel Coronavirus COVID-19"]]//Query[Select[chinaSelector]]//Query[Select[MemberQ[IntegerDigits/*First/@#Deaths["Values"],9]&],{#AdministrativeDivision,Flatten@Cases[#Deaths["DatePath"],{_,n_/;First[IntegerDigits[n]]9}]}&]
According to the Benford distribution, instead of just 2 we should be seeing a value closer to 62:
1364PDF[BenfordDistribution[10],9]//N
Out[]=
62.4132
Lets now study the second digit.
2nd Digit
2nd Digit
Here we compare the observed 2st digit frequencies vs the Newcomb Benford Distribution prediction.
GraphicsGrid[{{coronaBenfordPlot2["Deaths","NATO Countries",natoSelector],coronaBenfordPlot2["ConfirmedCases","NATO Countries",natoSelector]},{coronaBenfordPlot2["Deaths","China",chinaSelector],coronaBenfordPlot2["ConfirmedCases","China",chinaSelector]}},ImageSize600]
Out[]=
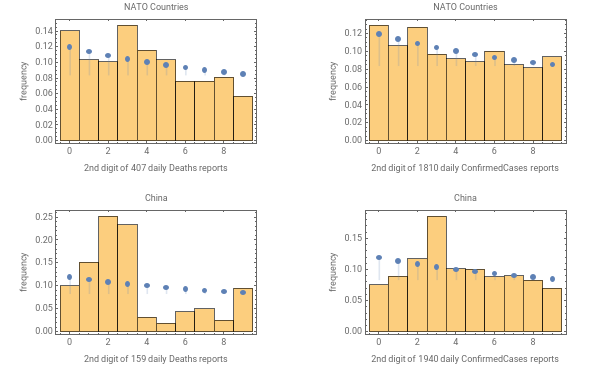
Again, in all cases the influence of the Benford Distribution is evident. For me, the most interesting result is the lower than expected frequency of zero as a second digit for the China confirmed cases. Note that as humans, when making up numbers we don’t like to produce nice numbers like 10, 20, 30, ... 100, 200,300... because they look too good. Just like when emulating coin flips we don’t like to create too many repeated values that in fact are seen in truly random coin flips.