Abstract : If you have a windows computer you can open your task manager, if you have a mac, the activity monitor. If you have never used the apps mentioned above, they demonstrate the tasks running in your computer in real time along with some visualisations. This project aims to recreate these applications, with the ultimate goal of making task management more efficient. While this was the goal, the takeaways from this project go beyond the final product. Doing this project or reading the essay can expand one’s knowledge on computers and how they function.
Overview and data
Overview and data
A big part of this project is to bring users closer to understanding their computers, so as to use them more mindfully. Generally, being more aware of one’s computer and keeping track of its workload can help people organize their computer better, preserve it and know what went wrong when errors or warnings show up. During this project I had to some research to understand some topics in order to comprehend the data I was working with and come up with useful visualisations. Like most projects, this starts with extracting data.
Below you can see the data I used and some explanations.
Below you can see the data I used and some explanations.
System process data:
A sample of the data in question
In[]:=
Take[SystemProcessData[],10]
Out[]=
Explanation of it’s contents
General:“PID” process ID“PPID” parent process ID“Memory” memory the process is using“StartTime” date the process was started“RealTime” time since the process started“SystemTime” CPU time spent in kernel space“UserTime” CPU time spent in user space“Threads” number of threads“User” the user the process belongs to“Program” name of the program“Path” full file path of the program“Dataset” dataset of all properties and values
information about all processes running on your computer system
In[]:=
Take[SystemProcessData[All],10]
Out[]=
About the root user:
The user named root, or superuser, is a special user account in UNIX-like operating systems that has unrestricted read and write privileges to all areas of the file system.
The user named root, or superuser, is a special user account in UNIX-like operating systems that has unrestricted read and write privileges to all areas of the file system.
As you can see Wolfram does not have access to all system information. It would have been convenient to extract data from my activity monitor but I could not find a way to do that.
Additional information that could not be found in system process data was extracted from...
Additional information that could not be found in system process data was extracted from...
System information:
outputs formatted tabs with information
In[]:=
SystemInformation[]
Out[]=
In[]:=
SystemInformation[All]
However by adding All, we get nested lists with the information
"Kernel""Version""14.0.0 for Mac OS X x86 (64-bit) (December 13, 2023)","ReleaseID""14.0.0.0 (9628082, 2023121323953)","LicenseID""L9793-8359","PatchLevel""0","ActivationKey""9793-8359-3Q9LVA","ActivationGroupID""L9793-8359","MachineID""5118-37019-07443","Username""Vivi","MachineName""Paraskevis-MacBook-Pro","LicenseServer""Paraskevis-MacBook-Pro.local","MaxLicenseProcesses"2,"LicenseExpirationDate","MachineType""PC","OperatingSystem""MacOSX","ProcessorType""x86-64","Language""English","CharacterEncoding""UTF-8","SystemCharacterEncoding""UTF-8","TimeZone"-4.,"CreationDate",...
And data from the terminal, using RunProcess(will be explained below, in the CPU sections).
Warning: Some terminal commands may not work on your computer if you try running the code on your computer.
Warning: Some terminal commands may not work on your computer if you try running the code on your computer.
My implementations
My implementations
Pstree
Pstree
Terms Explanation
Terms Explanation
A pstree: shows the relationship of all processes in a tree - like structure . This classification is based on the PIDs and the PPIDs given to tasks .
A PID: Short for Process IDentifier, is a unique number that identifies each running processes in an operating system . Process IDs, in the first place, are usually allocated on a sequential basis, beginning at 0 and rising to a maximum value which varies from system to system . Once this limit is reached, allocation restarts at 300 and again increases .
PPID: Each process is assigned a parent process ID (PPID) that tells which process started it . The PPID is the PID of the process' s parent .If process1 with a PID of 101 starts a process named process2, then process2 will be given a unique PID, such as 3240, but it will be given the PPID of 101.There are duplicate PPIDs
init: The grandfather of all processes on the system because all other processes run under it. In my computer it is called kernel_task and has a pid of 0. Launchd has a pid of 1 and that task calls the majority of other processes.
Code Explanation
Code Explanation
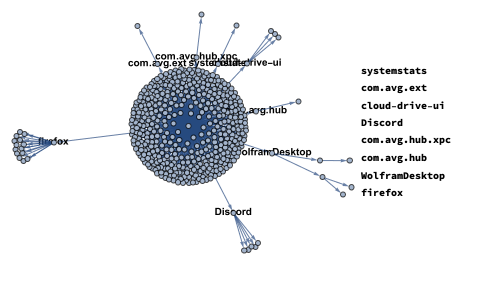
My goal was a graphic demonstration of these processes. In order to do that, I used SystemProcessData[All]. Note that this finction does not have access to the tasks with pid=0 or 1. Then, I extracted the pids and the ppids and connected them with EdgeDetect.
I also wanted to print the tasks names for those that branch out more.
The test was having a ppid of 1 and having children tasks.
This code was not dynamic, as it is a bit slow and does not change drastically over time.
I also wanted to print the tasks names for those that branch out more.
The test was having a ppid of 1 and having children tasks.
This code was not dynamic, as it is a bit slow and does not change drastically over time.
Code
Code
In[]:=
pstree=Module[{data,ppidlist,values,branches={}},data=SystemProcessData[All];ppidlist=Intersection[data[All,"PPID"],Select[data,#PPID==1&][All,"PID"]];values=Normal[Map[If[MemberQ[ppidlist,#["PID"]],branches=AppendTo[branches,Style[#["Program"],10,Bold]];Labeled[#PPID#["PID"],Placed[Style[#["Program"],10,Bold],"End"]],#PPID#["PID"]]&,data]];Row[{Graph[values,AspectRatio->.7,ImageSize->{300,300}],Column[branches]}]];
Example of the output
Memory pressure
Memory pressure
The general idea
The general idea
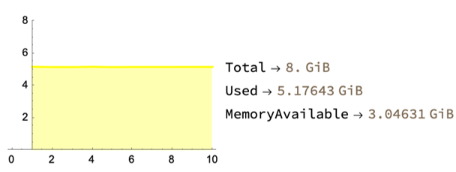
Finding the amount of memory that is being used and based on the percentage, color it differently, to indicate the pressure.
Code Explanation
Code Explanation
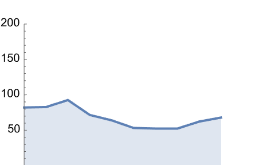
I used SystemInformation[All] for the data. I only needed three values: Physical Total, Physical Used and Memory Available. From that I calculated the percentage. If it was lower than 50, the color was green, if between 50 and 70, it was yellow and if more than that, red. Then, using ListLine plot, I visualised the percentage.
You will very often see this [[-10;;]] piece of code being used. That is because with dynamics I need to only be taking the last ten values.
You will very often see this [[-10;;]] piece of code being used. That is because with dynamics I need to only be taking the last ten values.
Code
Code
memoryPressure=DynamicModule[{data=SystemInformation[All],total,used,available,percentage,color,input=Table[0,10]},total=data[[-1,2,4,2]];Dynamic[data=SystemInformation[All];used=data[[-1,2,2,2]];available=data[[-1,2,1,2]];percentage=Round[used/total*100];color=Which[percentage<=50,Green,50<percentage<=70,Yellow,70<percentage<=100,Red];input=AppendTo[input,used][[-10;;]];Row[{ListLinePlot[input,Filling->Axis,FillingStyle->Lighter[color,0.7],PlotRange->{Automatic,{0,8}},PlotStyle->color,AxesOrigin->{1,0},ImageSize->{200,150}],Column[Table[data[[-1,2,i]],{i,{4,2,1}}]/.{"PhysicalTotal"->"Total","PhysicalUsed"->"Used"}]}],TrackedSymbols:>{},UpdateInterval->1]]
Example of the output:
Memory tasks
Memory tasks
The general idea
The general idea
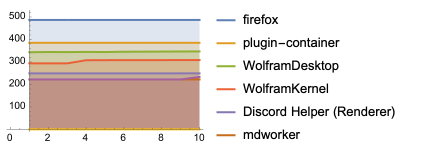
Plotting the most memory-heavy tasks together and labeling them.
Code Explanation
Code Explanation
I arranged SystemProcessData[] based on the memory. I needed the program name and the memory it takes up. But I came across the problem of reoccurring process names(like Google Chrome Helperer). To minimize noise, I added the values of these tasks and represented as one process. Finally I formatted the data as association pointing to lists of ten continuously changing values.
Code
Code
memoryTasks=DynamicModule[{values,keys,data,list,length,uniqueValues,uniqueKeys},list=Take[ReverseSortBy[SystemProcessData[],Key["Memory"]],6];keys=Normal[Transpose[list]["Program"]];length=Length[Values[PositionIndex[keys]]];uniqueKeys=Table[keys[[i]],{i,Flatten[Table[Take[Values[PositionIndex[keys]][[i]],1],{i,length}]]}];data=AssociationThread[uniqueKeys,Table[0,length,10]];Dynamic[list=Take[ReverseSortBy[SystemProcessData[],Key["Memory"]],6];keys=Normal[Transpose[list]["Program"]];values=Normal[Transpose[list]["Memory"]];length=Length[Values[PositionIndex[keys]]];uniqueValues=Table[Total[Table[values[[i]],{i,Values[PositionIndex[keys]][[j]]}]],{j,length}];uniqueKeys=Table[keys[[i]],{i,Flatten[Table[Take[Values[PositionIndex[keys]][[i]],1],{i,length}]]}];Table[If[KeyExistsQ[data,uniqueKeys[[i]]],data[uniqueKeys[[i]]]=Flatten[{Values[data][[i]],values[[i]]}][[-10;;]],AssociateTo[data,uniqueKeys[[i]]->Flatten[{Table[0,10,10],uniqueValues[[i]]}][[-10;;]]]],{i,length}];ListLinePlot[data,AxesOrigin->{1,0},PlotLegends->{uniqueKeys},Filling->Axis,ImageSize->{200,150}],TrackedSymbols:>{},UpdateInterval->1]];
Example of the output:
CPU load
CPU load
The general idea and terminal commands
The general idea and terminal commands
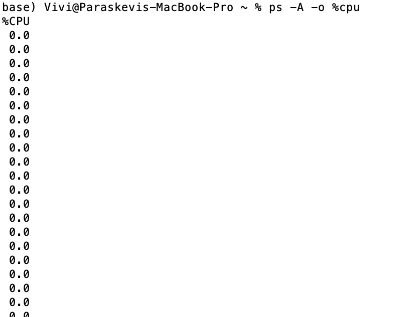
Like with memory, I wanted to demonstrate the amount of cpu that is used. The tricky part was the data. In this case, my source was the terminal. Because people may not be familiar with the commands I used, I want to explain them. These were:
ps -A -o %cpu and ps -A -o command
ps -A -o %cpu and ps -A -o command
◼
ps: Process status, information about processes running in memory
◼
-A: Display information about other users’ processes, including those without controlling terminals
◼
-o: How to display information
◼
%cpu: The pecentage of cpu very task takes up. Note that weirdly enough the maximum cpu usage is 200%
◼
command: extract the location of the processes. The file paths
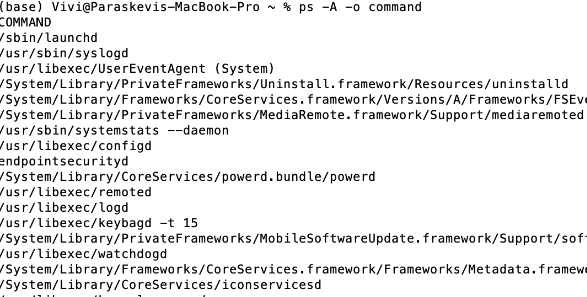
Screenshot example (please don’t hack my mom’s computer) :
Code Explanation
Code Explanation
For this part my only command was ps -A -o %cpu. RunProcess enables one to extract data from the terminal. It is just badly formatted. So I formatted the data and then added them up. That was the percentage. Then I just plotted the values. I used dynamic too. You can see that the cpu usage changes more dramatically than the memory usage. Also, this code does not any take time to run.
Code
Code
DynamicModule[{data,percentage,values},values=Table[0,10];Dynamic[data=ToExpression[#]&/@DeleteCases[StringDelete[StringSplit[Normal[RunProcess[{"ps", "-A", "-o" ,"%cpu"}]][[2,2]]],{"0.0","%CPU"}],""];percentage=Total[data]/2;values=Flatten[{values,percentage}][[-10;;]];ListLinePlot[values,Filling->Axis,ImageSize->{200,150},AxesOrigin->{1,0},PlotRange->{Automatic,{1,200}}]]]
Example of the output:
CPU tasks
CPU tasks
The general idea
The general idea
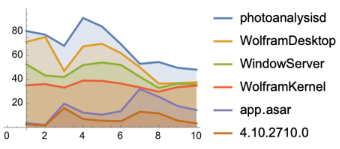
Like with memory, I wanted to demonstrate the tasks that take up most cpu. They were demonstrated with a list line plot and also drastically changed every second.
ps -A -o %cpu and ps -A -o command.
ps -A -o %cpu and ps -A -o command.
Code Explanation
Code Explanation
With %cpu I extracted the amount of cpu the tasks were taking up and with command, the file names associated with these percentages. The data formatting took some time too. Especially for the files. I did not want to show the file path, just the file name. Imagine we have a string like this.
COMMAND\\n/sbin/launchj\\n/usr/sbin/syslogd\\n/usr/libexec/UserEventAgent (System)\\n/System/Library/PrivateFrameworks/Uninstall.framework/Resources/uninstalld\\n/System/Library/Frameworks/CoreServices.framework/Versions/A/Frameworks/FSEvents.framework/Versions/A/Support/fseventsd\\n/System/Library/PrivateFrameworks/MediaRemote.framework/Support/mediaremoted\\n/usr/sbin/systemstats
....
I had to separate when \n occurred. Now I have a list of strings. Then when / occurred and I take only the last part. finally for cases like this (scary)
\\ n/Applications/Discord . app/Contents/Frameworks/Discord Helper (GPU) . app/Contents/MacOS/Discord Helper (GPU) -- type = gpu - process -- user - data - dir = /Users/Vivi/Library/Application Support/discord -- gpu - preferences = WAAAAAAAAAAgAAAEAAAAAAAAAAAAAAAAAABgAAEAAAA4AAAAAAAAAAAAAAAEAAAAAAAAAAAAAAAAAAAAAAAAAAAAAAAAAAAAaAcAAAAAAABoBwAAAAAAAHgCAABOAAAAcAIAAAAAAAB4AgAAAAAAAIACAAAAAAAAiAIAAAAAAACQAgAAAAAAAJgCAAAAAAAAoAIAAAAAAACoAgAAAAAAALACAAAAAAAAuAIAAAAAAADAAgAAAAAAAMgCAAAAAAAA0AIAAAAAAADYAgAAAAAAAOACAAAAAAAA6AIAAAAAAADwAgAAAAAAAPgCAAAAAAAAAAMAAAAAAAAIAwAAAAAAABADAAAAAAAAGAMAAAAAAAAgAwAAAAAAACgDAAAAAAAAMAMAAAAAAAA4AwAAAAAAAEADAAAAAAAASAMAAAAAAABQAwAAAAAAAFgDAAAAAAAAYAMAAAAAAABoAwAAAAAAAHADAAAAAAAAeAMAAAAAAACAAwAAAAAAAIgDAAAAAAAAkAMAAAAAAACYAwAAAAAAAKADAAAAAAAAqAMAAAAAAACwAwAAAAAAALgDAAAAAAAAwAMAAAAAAADIAwAAAAAAANADAAAAAAAA2AMAAAAAAADgAwAAAAAAAOgDAAAAAAAA8AMAAAAAAAD4AwAAAAAAAAAEAAAAAAAACAQAAAAAAAAQBAAAAAAAABgEAAAAAAAAIAQAAAAAAAAoBAAAAAAAADAEAAAAAAAAOAQAAAAAAABABAAAAAAAAEgEAAAAAAAAUAQAAAAAAABYBAAAAAAAAGAEAAAAAAAAaAQAAAAAAABwBAAAAAAAAHgEAAAAAAAAgAQAAAAAAACIBAAAAAAAAJAEAAAAAAAAmAQAAAAAAACgBAAAAAAAAKgEAAAAAAAAsAQAAAAAAAC4BAAAAAAAAMAEAAAAAAAAyAQAAAAAAADQBAAAAAAAANgEAAAAAAAAEAAAAAAAAAAAAAAAAAAAABAAAAAAAAAAAAAAAAEAAAAQAAAAAAAAAAAAAAACAAAAEAAAAAAAAAAAAAAAAwAAABAAAAAAAAAAAAAAAAYAAAAQAAAAAAAAAAAAAAAHAAAAEAAAAAAAAAAAAAAACAAAABAAAAAAAAAAAAAAAAkAAAAQAAAAAAAAAAAAAAALAAAAEAAAAAAAAAAAAAAADAAAABAAAAAAAAAAAAAAAA4AAAAQAAAAAAAAAAAAAAAPAAAAEAAAAAAAAAAAAAAAEAAAABAAAAAAAAAAAQAAAAAAAAAQAAAAAAAAAAEAAAABAAAAEAAAAAAAAAABAAAAAgAAABAAAAAAAAAAAQAAAAMAAAAQAAAAAAAAAAEAAAAGAAAAEAAAAAAAAAABAAAABwAAABAAAAAAAAAAAQAAAAgAAAAQAAAAAAAAAAEAAAAJAAAAEAAAAAAAAAABAAAACwAAABAAAAAAAAAAAQAAAAwAAAAQAAAAAAAAAAEAAAAOAAAAEAAAAAAAAAABAAAADwAAABAAAAAAAAAAAQAAABAAAAAQAAAAAAAAAAQAAAAAAAAAEAAAAAAAAAAEAAAAAQAAABAAAAAAAAAABAAAAAIAAAAQAAAAAAAAAAQAAAADAAAAEAAAAAAAAAAEAAAABgAAABAAAAAAAAAABAAAAAcAAAAQAAAAAAAAAAQAAAAIAAAAEAAAAAAAAAAEAAAACQAAABAAAAAAAAAABAAAAAsAAAAQAAAAAAAAAAQAAAAMAAAAEAAAAAAAAAAEAAAADgAAABAAAAAAAAAABAAAAA8AAAAQAAAAAAAAAAQAAAAQAAAAEAAAAAAAAAAHAAAAAAAAABAAAAAAAAAABwAAAAEAAAAQAAAAAAAAAAcAAAACAAAAEAAAAAAAAAAHAAAAAwAAABAAAAAAAAAABwAAAAYAAAAQAAAAAAAAAAcAAAAHAAAAEAAAAAAAAAAHAAAACAAAABAAAAAAAAAABwAAAAkAAAAQAAAAAAAAAAcAAAALAAAAEAAAAAAAAAAHAAAADAAAABAAAAAAAAAABwAAAA4AAAAQAAAAAAAAAAcAAAAPAAAAEAAAAAAAAAAHAAAAEAAAABAAAAAAAAAACAAAAAAAAAAQAAAAAAAAAAgAAAABAAAAEAAAAAAAAAAIAAAAAgAAABAAAAAAAAAACAAAAAMAAAAQAAAAAAAAAAgAAAAGAAAAEAAAAAAAAAAIAAAABwAAABAAAAAAAAAACAAAAAgAAAAQAAAAAAAAAAgAAAAJAAAAEAAAAAAAAAAIAAAACwAAABAAAAAAAAAACAAAAAwAAAAQAAAAAAAAAAgAAAAOAAAAEAAAAAAAAAAIAAAADwAAABAAAAAAAAAACAAAABAAAAAQAAAAAAAAAAoAAAAAAAAAEAAAAAAAAAAKAAAAAQAAABAAAAAAAAAACgAAAAIAAAAQAAAAAAAAAAoAAAADAAAAEAAAAAAAAAAKAAAABgAAABAAAAAAAAAACgAAAAcAAAAQAAAAAAAAAAoAAAAIAAAAEAAAAAAAAAAKAAAACQAAABAAAAAAAAAACgAAAAsAAAAQAAAAAAAAAAoAAAAMAAAAEAAAAAAAAAAKAAAADgAAABAAAAAAAAAACgAAAA8AAAAQAAAAAAAAAAoAAAAQAAAACAAAAAAAAAAIAAAAAAAAAA == --shared - files -- field - trial - handle = 1718379636, r, 12866881972050669713, 7734032404777864146, 262144 -- enable - features = kWebSQLAccess -- disable - features = HardwareMediaKeyHandling, MediaSessionService, SpareRendererForSitePerProcess, WinRetrieveSuggestionsOnlyOnDemand -- variations - seed - version -- seatbelt - client = 35
I did StringSplit and took the first part. Cool. Then I made an association and demonstrated the top 6 tasks.
I did StringSplit and took the first part. Cool. Then I made an association and demonstrated the top 6 tasks.
Code
Code
cpuTasks=DynamicModule[{data,cpu,pid,assoc,command,percentage,input},data={RunProcess[{"ps", "-A", "-o" ,"%cpu"}],RunProcess[{"ps", "-A", "-o" ,"command"}]};cpu=ToExpression[#]&/@StringSplit[ StringDelete[Normal[data[[1]]][[2,2]],"%CPU"]];command=StringSplit[StringSplit[#,"/"][[-1]]][[1]]&/@StringSplit[StringDelete[data[[2]][[2]],"COMMAND"],"\n"];assoc=Take[Sort[AssociationThread[command,cpu],Greater],6];input=AssociationThread[Keys[assoc],Table[0,6,10]];Dynamic[data={RunProcess[{"ps", "-A", "-o" ,"%cpu"}],RunProcess[{"ps", "-A", "-o" ,"command"}]};cpu=ToExpression[#]&/@StringSplit[ StringDelete[Normal[data[[1]]][[2,2]],"%CPU"]];command=StringSplit[StringSplit[#,"/"][[-1]]][[1]]&/@StringSplit[StringDelete[data[[2]][[2]],"COMMAND"],"\n"];assoc=Take[Sort[AssociationThread[command,cpu],Greater],6];percentage=Values[assoc];Table[input[[i]]=Flatten[{Values[input][[i]],percentage[[i]]}][[-10;;]],{i,6}];ListLinePlot[input,AxesOrigin->{1,0},PlotLegends->{Keys[input]},Filling->Axis,ImageSize->{200,150}],TrackedSymbols:>{},UpdateInterval->.5]]
Example of the output:
Running for a long time
Running for a long time
Objective and code explanation
Objective and code explanation
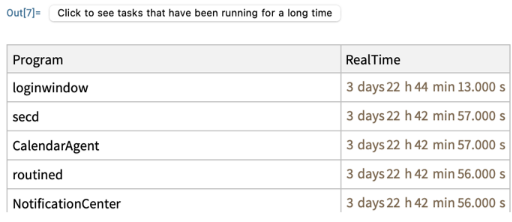
A fairly easy but useful classification was outputting tasks running for a long time. It is interesting becoming aware of a task on your computer that has been running for 64 days. The limit I set was a week.
I extracted the tasks that take up more than 10 MB of memory. Then classified SystemProcessData[All] based on RealTime. Finally, I selected the tasks that run for more than 7 days (RealTie > 7 days). This implementation only shows up if there are actually tasks that have been running for so long and the often long list of programs shows only when the button is clicked.
I extracted the tasks that take up more than 10 MB of memory. Then classified SystemProcessData[All] based on RealTime. Finally, I selected the tasks that run for more than 7 days (RealTie > 7 days). This implementation only shows up if there are actually tasks that have been running for so long and the often long list of programs shows only when the button is clicked.
Code
Code
In[]:=
lookInto=ModulelookInto=Take[SortBy[SystemProcessData[All],Key["PPID"]]]SelectNot[MissingQ[#Memory]]&&#Memory>&&#RealTime>&[All,{"Program","RealTime"}],If[Length[lookInto]>0,Button[Style["Click to see tasks that have been running for a long time",10],CellPrint[lookInto]]];
Example of the output (ignore the 3 days, I had restarted my computer some days before this)
Final result
Final result
The objective
The objective
To demonstrate all the output above in one go.
Code Explanation
Code Explanation
I used TabView and PopupWindow to display my output. In the first tab, I demonstrated the pstree. In the second the CPU load and tasks and in the the third the memory pressure, the memory-heavy tasks and the tasks that have been running for more than a week. There is also a version without a popup window.
Code
Code
Text this one for yourself
In[]:=
CreateWindow[DialogNotebook[TabView[{"Pstree"->pstree,"CPU"->Column[{cpuLoad,cpuTasks}],"Memory"->Column[{memoryPressure,memoryTasks,lookInto}]},Alignment->Center,FrameMargins->None]]]
In[]:=
TabView[{"Pstree"->pstree,"CPU"->Column[{cpuLoad,cpuTasks}],"Memory"->Column[{memoryPressure,memoryTasks,lookInto}]},Alignment->Center,FrameMargins->None]
Conclusion
Conclusion
Expansion
Expansion
Possible extensions are plotting the tasks that affect the battery/ need much energy. I would have done this too if I had more time. It is quite interesting. Here is some information about how the energy of a task is measured:
Energy Impact: A relative measure of the current energy consumption of the app. Lower numbers are better.
Based on the top command:
POWER is a unitless measure because it is a semi-arbitrary combination of two measures with incompatible units.
In every case, Activity Monitor’s “Energy Impact” was the same as top’s POWER measure. Every indication is that the two are computed identically on this machine.
the code used:
|elapsed_us| is the length of the sample period
|used_us| is the time this process was running during the sample period
%CPU = (used_us * 100.0) / elapsed_us
POWER = if is_a_kernel_process()
0
else
((used_us + IDLEW * 500) * 100.0) / elapsed_us
From that, I could probably write a function and display the tasks that take up most memory.
Acknowledgments
Acknowledgments
This project would not have been possible without the help of my mentor, the TAs and the directors in this program. Thank you for your helpful advice!
Citations
Citations
◼
Check out the following links
CITE THIS NOTEBOOK
CITE THIS NOTEBOOK
User-friendly computer monitor
by Danae Dresiou
Wolfram Community, STAFF PICKS, July 11, 2024
https://community.wolfram.com/groups/-/m/t/3214919
by Danae Dresiou
Wolfram Community, STAFF PICKS, July 11, 2024
https://community.wolfram.com/groups/-/m/t/3214919