Sources on nuclear detonations might differ significantly on a topic so sensitive, in which powerful countries are globally responsible for making even their own citizens victims of tests. Therefore, visualizing data related to nuclear detonations is important to understand their power as well as to give a sense of their effect on the environment and their victims. Here I present multiple ways to visualize relevant data and effects of nuclear explosions with interactive historical data from the Wolfram Knowledgebase.
Since the first nuclear test explosion ‘Trinity’ detonated by The United States on July 16, 1945, at least eight nations have detonated 2431 nuclear explosions at dozens of test sites (data from . Let’s check how many nuclear explosions can be accessed in Wolfram Knowledgebase.
4
2017)
Check how many nuclear explosions can be accessed in Wolfram Knowledgebase:
In[]:=
EntityList[EntityClass["NuclearExplosion",All]]//Length
Out[]=
2431
Check the data source:
In[]:=
EntityValue["NuclearExplosion","DetonatedBy","Source"]
Out[]=
{JohnstonsArchiveNuclearTestsDatabase}
Most of the detonations have been underground specially, after the sign of the 1963 treaty banning nuclear weapon tests in the atmosphere, in outer space and under water, which prohibited all test detonations of nuclear weapons except for those conducted underground known as the Limited Test Ban Treaty (LTBT).
List all test types by their multiplicities:
In[]:=
EntityValue[EntityClass["NuclearExplosion",All],"TestType"]//Tally//ReverseSortBy[Last]
Out[]=
{{underground shaft,1339},{underground tunnel,522},{atmospheric,170},{atmospheric, air drop,85},{atmospheric, earth surface, tower,79},{atmospheric, balloon,62},{atmospheric, earth surface,58},{atmospheric, barge at water surface,41},{underground,13},{cratering burst, shallow subsurface,13},{atmospheric, rocket or missile,13},{space, rocket or missile,10},{underground cavity shaft,7},{underwater,5},{atmospheric high altitude, rocket,5},{underwater, anti-submarine weapon or torpedo,2},{underwater, barge,1},{underground mine,1},{atmospheric, earth surface, rocket,1},{atmospheric, earth surface, air drop,1},{atmospheric, cruise missile at water surface,1},{atmospheric, cruise missile,1},{atmospheric, anti-submarine weapon or torpedo at water surface,1}}
As expected, most detonations occurred during the Cold War with the maximum peak during the Cuban Missile Crisis. In 1987, the United States and the Soviet Union had signed the Intermediate-Range Nuclear Forces Treaty (INF). The United States withdrew from the INF treaty in 2019, however, believing that Russia was noncompliant. This can be represented using DateHistogram to visualize the detonations counts and TimelinePlot to overlay historical events:
Plot an overlay of the date histogram of the nuclear explosions by the country that detonated it and a time line of relevant events:
In[]:=
ManipulateShowDateHistogram[GroupBy[Select[EntityValue["NuclearExplosion",{"DetonatedBy","Date"}],MemberQ[var,First[#]]&],FirstLast],ImageSizeLarge,AxesLabel{"Year","Detonations count"},ChartBaseStyleOpacity[1],ChartLayout"Stacked",ChartLegendsAutomatic],TimelinePlotLabeled[DateInterval[#[{"StartDate","EndDate"}]],#["Name"],After]&@,,,Spacings{240,0,0,0,0,0,0},FillingAxis,FillingStyleOpacity[0.2],PlotRange{0,290},ImageSize470//MapAt[Reverse,{1,1}],var,,"Countries",#->CommonName[#]&/@DeleteDuplicates[EntityValue["NuclearExplosion","DetonatedBy"]],ControlTypeTogglerBar,SaveDefinitionsTrue
Out[]=

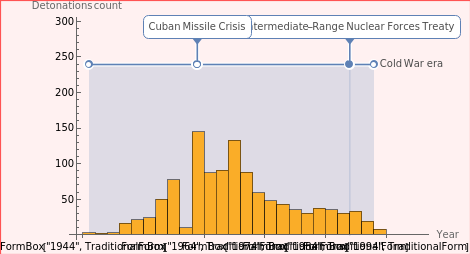
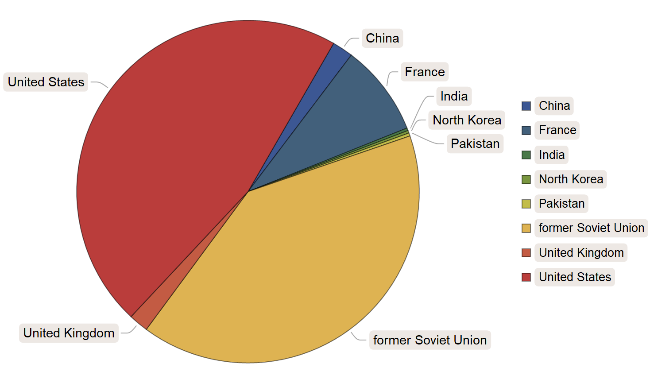
Most explosions were detonated by the former Soviet Union and the United States.
Get a pie chart of the countries that have detonated a nuclear explosion:
In[]:=
PieChart[Counts@Flatten@EntityValue[EntityClass["NuclearExplosion",All],"DetonatedBy"],ChartLabelsCallout[Style[#,14]&/@DeleteDuplicates[EntityValue["NuclearExplosion","DetonatedBy"]]],ChartLegendsAutomatic,SectorOrigin{π/3,"Clockwise"},ChartStyle"DarkRainbow",ImageSize550,PlotRangeAll]
Out[]=
Nuclear explosions in French Polynesia
Nuclear explosions in French Polynesia
French Polynesia’s main island, Tahiti, became a French protectorate in 1842, and France took possession of French Polynesia as a whole in 1880. Between 1946 and 2003, French Polynesia had the status of an overseas territory but in 2003 was declared an overseas collectivity of France consisting of five archipelagos in the south-central Pacific. Today, the collectivity has control over their primary and secondary education, health, town planning, and the environment but not has no competence in justice, university education, security and defense which are administered by the government of mainland France. French Polynesians are French citizens with the right to live in France and entitled to vote in local and French national elections. French Polynesia sends two senators to the French Senate and also three deputies to the French National Assembly. Read more about the history of the country here.
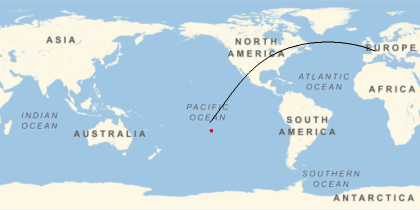
The islands are considerably far from Europe.
French Polynesia’s main island, Tahiti, became a French protectorate in 1842, and France took possession of French Polynesia as a whole in 1880. Between 1946 and 2003, French Polynesia had the status of an overseas territory but in 2003 was declared an overseas collectivity of France consisting of five archipelagos in the south-central Pacific
5
Ocean
The islands are considerably far from Europe.
Represent the geographical distance between French Polynesia and France:
In[]:=
GeoGraphicsGeoPath,,Red,Point@EntityValue[propertyInFP,"Position"],GeoCenter
Out[]=
France conducted 193 nuclear tests from 1966 to 1996 at Moruroa and Fangataufa atolls in French Polynesia. The database from JohnStonsArchive contains information of 189 of them:
France conducted 193 nuclear tests from 1966 to 1996 at Moruroa and Fangataufa atolls in French Polynesia. The database from JohnStonsArchive contains information of 189 of them:
Get the nuclear explosion detonated in French Polynesia and return the length of the list:
In[]:=
propertyInFP=EntityClass"NuclearExplosion",;EntityList@propertyInFP//Length
Out[]=
189
Once the tests began in 1966, the impacts turned towards the health of the local environment, the local inhabitants and the thousands of migrant workers, who were “poorly briefed” on the potential consequences of radiation by the state.
- Kim Feldmann
Once the tests began in 1966, the impacts turned towards the health of the local environment, the local inhabitants and the thousands of migrant workers, who were “poorly briefed” on the potential consequences of radiation by the state.
- Kim Feldmann
- Kim Feldmann
In a nuclear explosion the huge amount of energy the explosion produces derives from the fission of radioactive materials, e.g . Uranium-235 and Plutonium-239, or in another words, the formation of different atomic nuclei by the redistribution of the protons and neutrons within the interacting . Their significance may best be appreciated by the coining of the words kiloton (1,000 tons) and megaton (1,000,000 tons) to describe their blast . The “ton of TNT” is a unit of energy equal to 4.184 gigajoules (1gigacalorie), which is approximately the amount of energy released in the detonation of a ton of . This release of energy includes a blast of ionizing radiation carried predominantly by gamma rays and neutrons produced within the first minutes after the explosion that can be spread up to dozens of kilometers from the center of the detonation affecting the surrounding area. The Wolfram Knowledgebase provides. among others, the energy and position where the explosions were detonated.
1,2
nuclei
3
energy
CITE
TNT(trinitrotoluene)
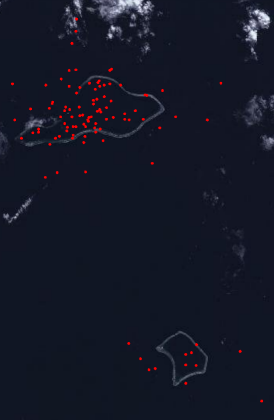
Represent the location where the nuclear explosions were detonated in French Polynesia:
In[]:=
GeoGraphics[{Red,Point@EntityValue[propertyInFP,"Position"]},GeoBackground"Satellite"]
Out[]=
ResourceFunction[“NuclearWeaponEffects”] takes a value of energy from1 kiloton to 20,000 kilotons of TNT and returns the effects of a nuclear weapon detonation yielding that energy. By providing the value of the energy yielded by the nuclear detonations in French Polynesia to ResourceFunction[“NuclearWeaponEffects”], and combining it with GeoDisk and GeoGraphics, it is possible to visualize the area where the dangerous radiation was released.
Get the position and energy yielded by the nuclear explosions detonated in French Polynesia:
In[]:=
bombs=EntityValue[propertyInFP,{"Position","Yield"},"EntityAssociation"];
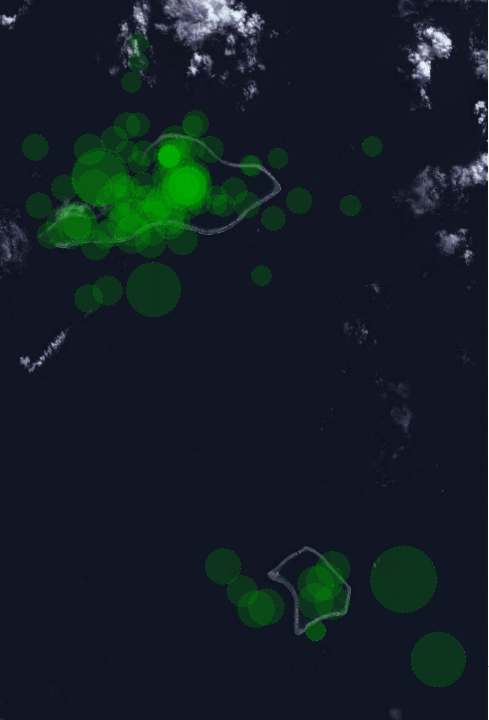
Represent the ionizing radiation radius of the nuclear explosions detonated in French Polynesia that are available in the Wolfram Knowledgebase:
In[]:=
bubbles=MapAt[#["IonizingRadiationRadius"]&,DeleteCases[Quiet@MapAt[ResourceFunction["NuclearWeaponEffects"],bombs,{All,2}],{_,$Failed}],{All,2}];GeoGraphics[{GeoStyling[Directive[Opacity[0.2],EdgeForm[Directive[Thin,Dotted,Green]],Darker@Green]],GeoDisk@@@bubbles},GeoBackground"Satellite",ImageSizeLarge]
Out[]=
For the roughly 126000 military personnel and civilians estimated to have had direct contact with residual radioactive materials from the tests, potential health impacts such as various cancers. The main health concern from exposure to ionising radiation emitted from radioactive fallout is the development of thyroid cancer among people exposed in childhood.4,6
Till now, the amount of information available on the tests conducted in French Polynesia in the late 1960s and early 1970s remains insufficient to provide any detailed evaluation of past and present radiation exposures and the optimal assessment of the health consequences for local populations in French Polynesia. The Mururoa Files suggest that in fact, the contamination on Tahiti was underestimated by as much as 40%, potentially allowing tens of thousands more people to be officially recognised as test victims. Nuclear tests in French Polynesia were condemned internationally, notably by the government of other Asian-Pacific countries, including New-Zealand.
Till now, the amount of information available on the tests conducted in French Polynesia in the late 1960s and early 1970s remains insufficient to provide any detailed evaluation of past and present radiation exposures and the optimal assessment of the health consequences for local populations in French Polynesia. The Mururoa Files suggest that in fact, the contamination on Tahiti was underestimated by as much as 40%, potentially allowing tens of thousands more people to be officially recognised as test victims. Nuclear tests in French Polynesia were condemned internationally, notably by the government of other Asian-Pacific countries, including New-Zealand.
Thermal effects
Thermal effects
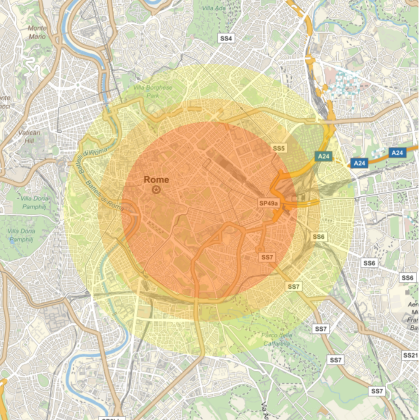
Approximately 35 percent of the total energy yield of an airburst is emitted as thermal radiation—light and heat capable of causing skin burns and eye injuries and starting fires of combustible material at considerable distances. To visualize the thermal effects of a nuclear explosion, a combination of ResourceFunction[“NuclearWeaponEffects”] and GeoGraphics can be used. ResourceFunction[“NuclearWeaponEffects”] returns the radius of the thermal radiation capable of producing a specific degree of burns in human skin. In this case, we used GeoDisk with center in the city of Rome and the radius corresponding to each degree of the thermal radiation yielded by the nuclear bomb ‘Little Boy’ dropped by The United Stated on the Japanese city of Hiroshima on 6 August 1945 during World War II:
Represent the thermal radiation radius that can cause different degrees of burns degree from the detonation of the nuclear bomb ‘Little Boy’ if it were detonated in Rome:
In[]:=
littleBoy=ResourceFunction["NuclearWeaponEffects"][Entity["NuclearExplosion","UnitedStates08051945"][EntityProperty["NuclearExplosion","Yield"]]];GeoGraphicsYellow,GeoDisk,littleBoy["ThermalRadiationRadius1stDegreeBurns"],Orange,GeoDisk,littleBoy["ThermalRadiationRadius2ndDegreeBurns"],Red,GeoDisk,littleBoy["ThermalRadiationRadius3rdDegreeBurns"],GeoRange->Quantity[3,"Miles"]
Out[]=
This type of data -that is ofter hard to size in our mind- needs creative forms of visualization that allows to capture the reader’s attention on the devastating effects of the wrong use of the nuclear energy, particularly when this detonations seem to be so distant both in space and time. In this post, several ways to visualize this data had been shown and Wolfram Language offers dozens more useful function to do so. It is a requirement to honor the victims that we as citizens of the world have clear the risks and consequences of the use and tests of nuclear weapons and by researching and sharing data we take step in doing so.
References
References
◼
[1] S . Glasstone and P. J. Dolan, The Effects of Nuclear Weapons, 3 rd ed ., United States Department of Defense and the Energy Research and Development Administration, 1977, pp. 1–2.
◼
[2] In ibid ., Glasstone and Dolan note that "What is sometimes referred to as atomic energy is thus actually nuclear energy, since it results from particular nuclear interactions . It is for the same reason, too, that atomic weapons are preferably called 'nuclear weapons'".
◼
[3] Norris, Robert S. and Cochran, Thomas B.. “Nuclear weapon”. Encyclopedia Britannica, 12 Dec. 2019, https://www.britannica.com/technology/nuclear-weapon. Accessed 18 March 2021.
◼
[4] Daryl Kimball. “The Nuclear Testing Tally”. Arms Control Association, July 2020, https://www.armscontrol.org/factsheets/nucleartesttally. Accessed 18 March 2021.
◼
[5] West, Francis James and Foster, Sophie. “French Polynesia”. Encyclopedia Britannica, 1 Feb. 2021, https://www.britannica.com/place/French-Polynesia. Accessed 19 March 2021.
◼
[6] Health effects of nuclear weapons testing. Available from: https://www.researchgate.net/publication/280969320_Health_effects_of_nuclear_weapons_testing. Accessed Feb 15 2021.
◼
[7] Nuclear Tests in French Polynesia. Available from: https://www.researchgate.net/publication/265559584_Nuclear_Tests_in_French_Polynesia. Accessed Feb 15 2021.