A Surface On The Cover of The First Mathematica Book
J. M., 1/16/2024
J. M., 1/16/2024
Since version 14 of Mathematica had just come out, I thought it might be a nice time to revisit something from the beginning of Mathematica’s history:
EntityValue,
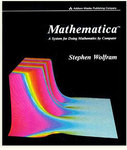
The cover of the first edition of The Mathematica Book featured a plot of the absolute value of the Riemann zeta function (Zeta[s]) over the complex plane, with coloring dependent on the argument. I still have version 5 in the computer I am currently using, so I can show you how it looked like:
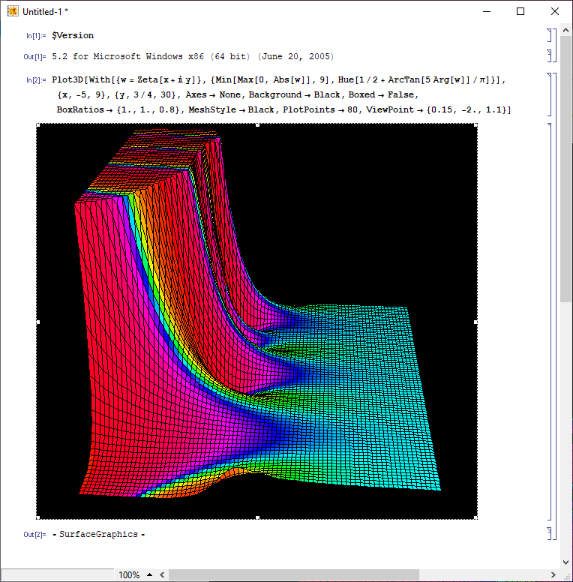
Plot3D had changed so much in the intervening years (e.g. from producing a dedicated SurfaceGraphics object fro versions 5 and below, to a Graphics3D object in subsequent versions), so the original code needs to be modified quite a bit to get a qualitatively similar picture. This is what I got:
Plot3D[Min[Max[0,Abs[Zeta[x+y]]],9],{x,-5,9},{y,3/4,30},AxesNone,BackgroundBlack,BoxedFalse,BoxRatios{1.,1.,0.8},ColorFunctionFunction[{x,y},Hue[1/2+ArcTan[5Arg[Zeta[x+y]]]/π]],ColorFunctionScalingFalse,ExclusionsNone,ImageSizeLarge,Mesh80,MeshStyleBlack,ViewPoint{0.15,-2.,1.1}]
Out[]=

We’ve definitely come a long way since version 1! Who knows what future versions might have in store…