Amino Acids in Wolfram Language
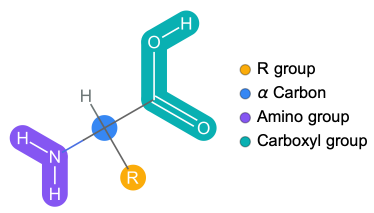
Basic structure
Basic structure
Created by Jason Biggs
Out[]=
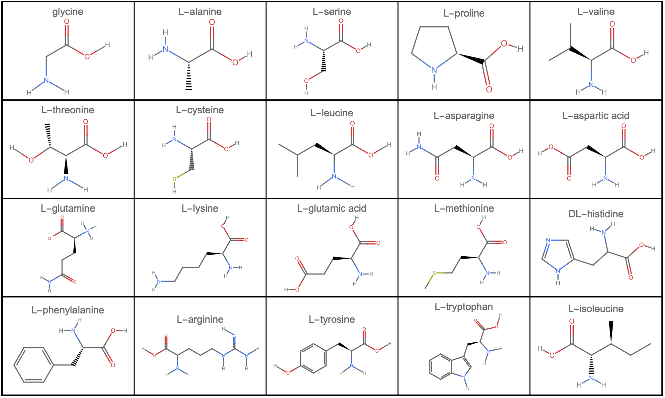
Visualizing 2D structure of amino acids in Wolfram Language
Visualizing 2D structure of amino acids in Wolfram Language
In[]:=
GraphicsGrid[Partition[MoleculePlot[#,PlotLabel->#["Name"]]&/@EntityList@EntityClass["Chemical","AminoAcids"],UpTo[5]],Frame->All,ImageSize->800]
Out[]=
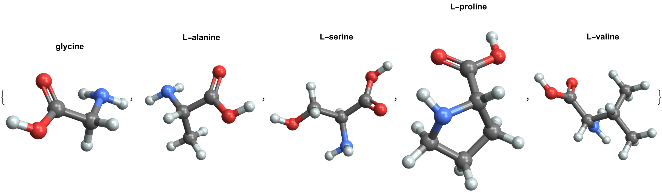
Visualizing 3D structure of amino acids in Wolfram Language
Visualizing 3D structure of amino acids in Wolfram Language
In[]:=
MoleculePlot3D[#,PlotLabel->Style[#["Name"],Black,Bold]]&/@(EntityList@EntityClass["Chemical","AminoAcids"])[[1;;5]]
Out[]=
Peptides in Wolfram Language
Peptide is a string of covalently bonded amino acids which are not folded into any specific structure.
Visualizing peptides in Wolfram Language
Visualizing peptides in Wolfram Language
Visualize in 2D
Visualize in 2D
BioSequenceMoleculePlot function created by Jan Mangaldan
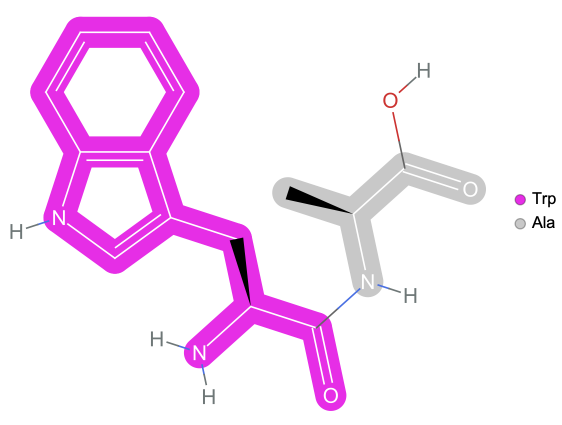
Visualize dipeptide
In[]:=
ResourceFunction["BioSequenceMoleculePlot"][BioSequence["Peptide","WA"]]
Out[]=
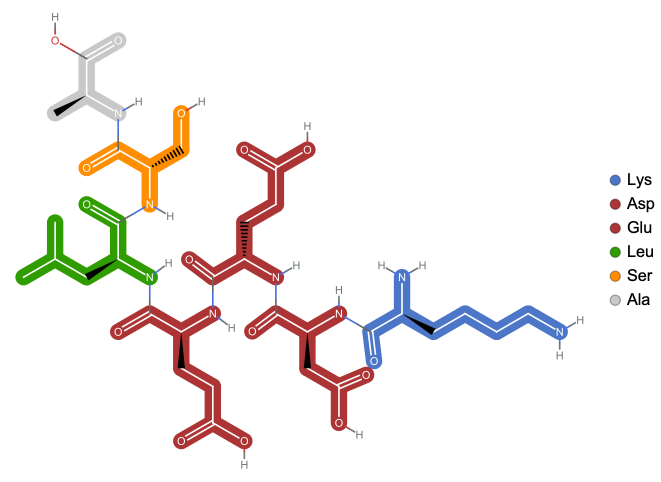
Visualize polypeptide
In[]:=
ResourceFunction["BioSequenceMoleculePlot"][BioSequence["Peptide","KDEELSA"]]
Out[]=
Visualize in 3D
Visualize in 3D
BioSequenceMoleculePlot3D function created by Jan Mangaldan
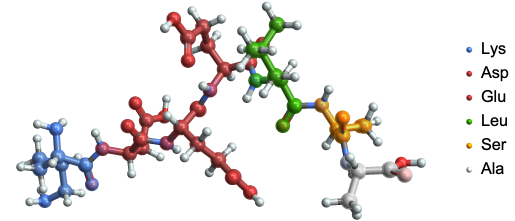
Poly-peptide bonds
In[]:=
ResourceFunction["BioSequenceMoleculePlot3D"][BioSequence["Peptide","KDEELSA"]]
Out[]=
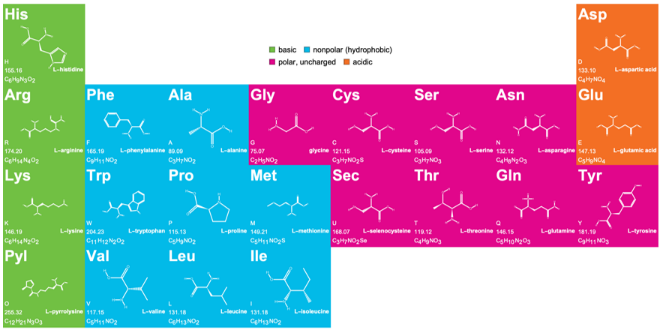
Amino acid chart with three and one letter codes
Amino acid chart with three and one letter codes
Created by Jan Mangaldan
Proteins in Wolfram Language
Polypeptides vs proteins
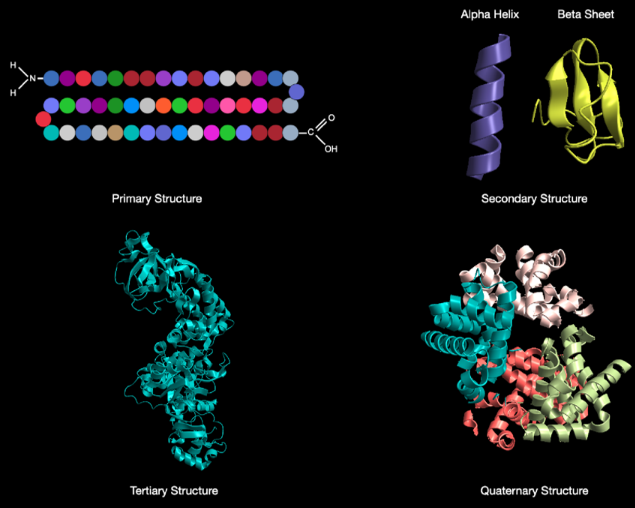
Polypeptides vs proteins
Technically, a polypeptide is a string of covalently bonded amino acids which are not folded into any specific structure - whereas a protein is a string of covalently bonded amino acids that has folded into its correct shape.
Learning about proteins using the Wolfram ProteinVisualization paclet!
Learning about proteins using the Wolfram ProteinVisualization paclet!
The Wolfram ProteinVisualization paclet : https://resources.wolframcloud.com/PacletRepository/resources/WolframChemistry/ProteinVisualization/
Community post on using the paclet : https://community.wolfram.com/groups/-/m/t/2927764
Install and load the paclet
Install and load the paclet
To download this paclet in your Wolfram Language environment, evaluate this code:
In[]:=
PacletInstall["WolframChemistry/ProteinVisualization"]
Out[]=
To load the code after installation, evaluate this code:
In[]:=
Needs["WolframChemistry`ProteinVisualization`"]
Usual way of visualizing proteins using Wolfram Language
Usual way of visualizing proteins using Wolfram Language
BioMoleculePlot3D function created by Soutick Saha, Jan Mangaldan and Jason Biggs
In[]:=
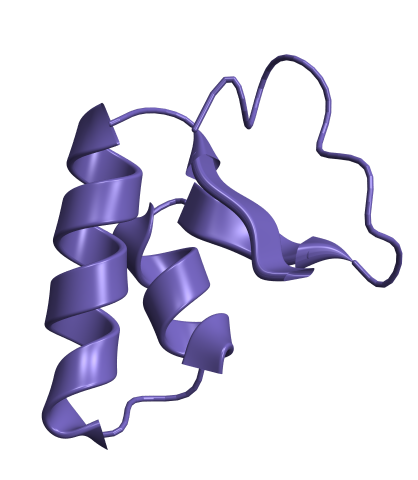
ResourceFunction["BioMoleculePlot3D"]"1CRN","ChainStyle"->
Out[]=
Visualize protein backbone with ProteinBackboneAtomPlot
Visualize protein backbone with ProteinBackboneAtomPlot
In[]:=
ProteinBackboneAtomPlot["1CRN"]
Out[]=
Amino acid side chains can be shown using “ShowSideChains” Option:
In[]:=
ProteinBackboneAtomPlot["1CRN","ShowSideChains"->True]
Out[]=
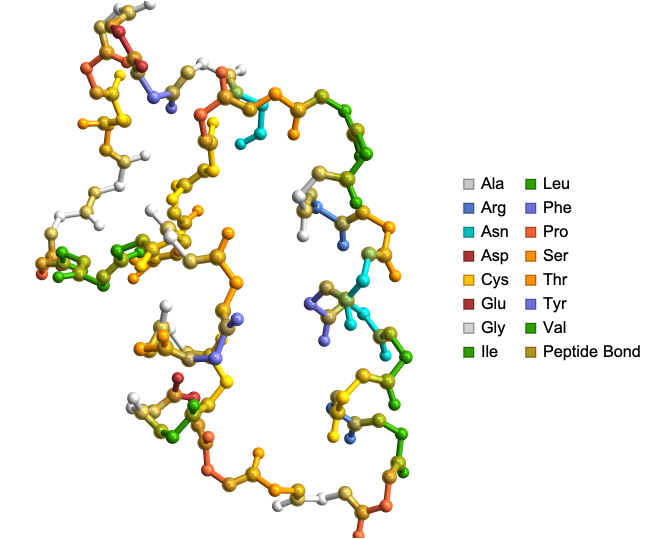
Peptide bonds can be shown using “HighlightPeptideBond” Option. Useful for educational purposes:
In[]:=
ProteinBackboneAtomPlot["1CRN","HighlightPeptideBond"->True]
Out[]=
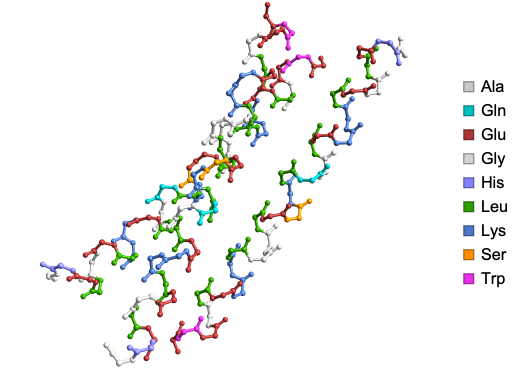
Residue and chain information can be displayed upon mouse hover using “AtomDisplayFunction” Option. Here is the structure of synthetic triple-stranded alpha-helical bundle:
In[]:=
ProteinBackboneAtomPlot["1COS","AtomDisplayFunction"->Tooltip]
Out[]=
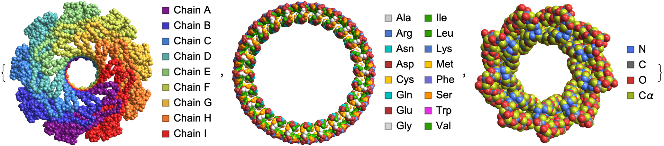
“BackboneColorRules” option can be used to visualize the protein backbones by chains or residues or atoms. Here are the structures of Lysenin Pore (left), circular tandem repeat protein (center) and alpha single-chain toroid (right):
In[]:=
{ProteinBackboneAtomPlot["5GAQ",PlotTheme->"SpaceFilling","BackboneColorRules"->{"Chains",Automatic}],ProteinBackboneAtomPlot["7RDR",PlotTheme->"SpaceFilling","BackboneColorRules"->{"Residues",Automatic}],ProteinBackboneAtomPlot["6XR1",PlotTheme->"SpaceFilling","BackboneColorRules"->{"Atoms",Automatic}]}
Out[]=
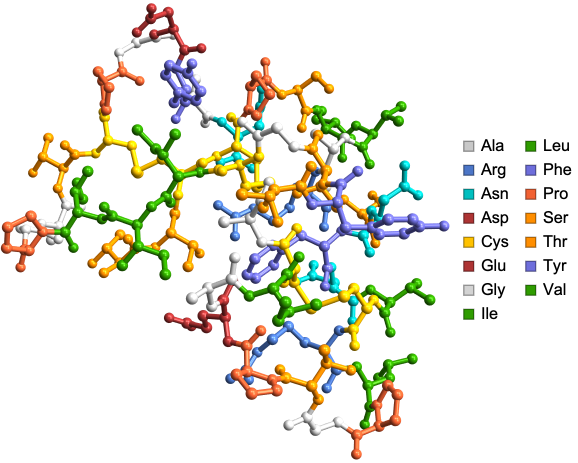
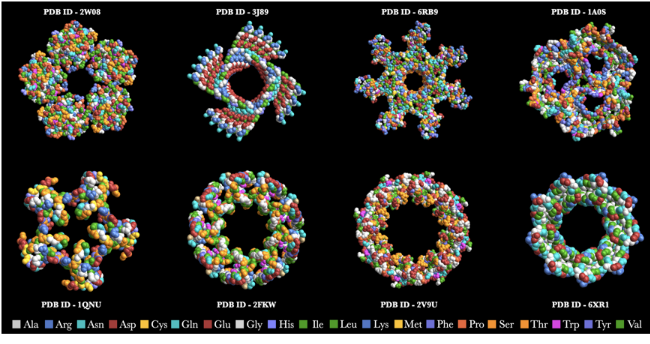
Some elegant protein structures created using the ProteinBackboneAtomPlot function color coded by amino acids!
Some elegant protein structures created using the ProteinBackboneAtomPlot function color coded by amino acids!
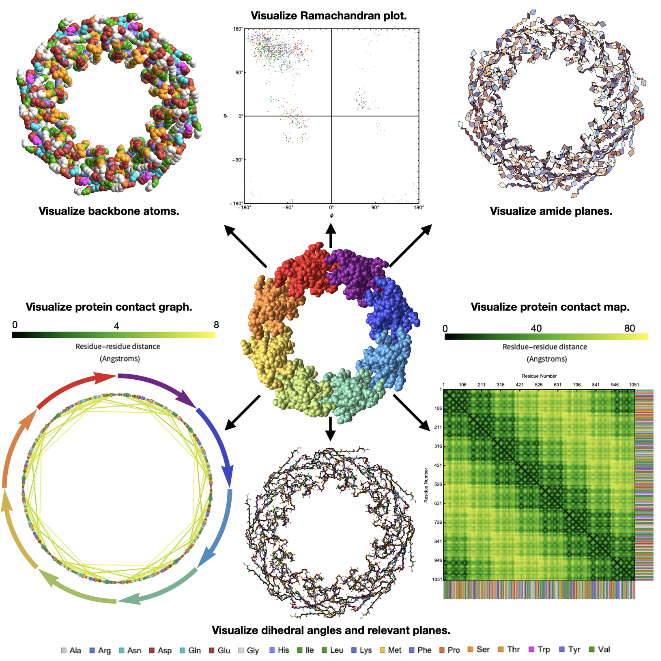
Teaching protein structures to students in Wolfram Language
ProteinBackboneAtomPlot is just one of the three functions created specifically with educators in mind. The other two are AmidePlanePlot and DihedralAnglePlot.
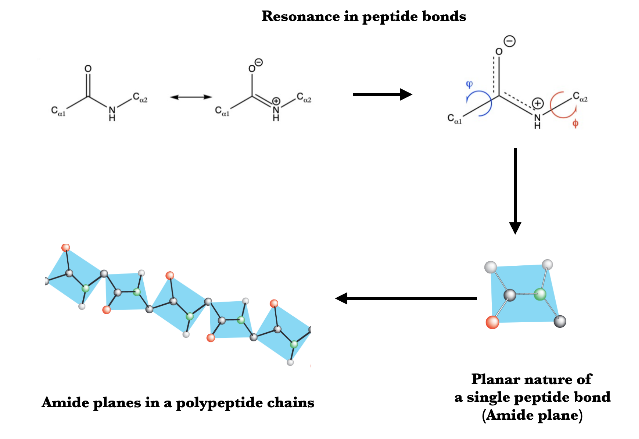
Amide plane visualization in proteins
Amide plane visualization in proteins
Resonance in peptide bonds image source : https://masteringcollegebiochemistry.wordpress.com/2019/01/15/protein-structure-peptide-bonds/
Amide planes image source : http://www.smallscalechemistry.colostate.edu/PowerfulPictures/ProteinStructure.pdf
◼
Question that led to creation of AmidePlanePlot function : Is this true in actual protein structures, and if so, how do I visualize them?
◼
To the best of my knowledge this is the first package to offer visualization of amide planes in proteins
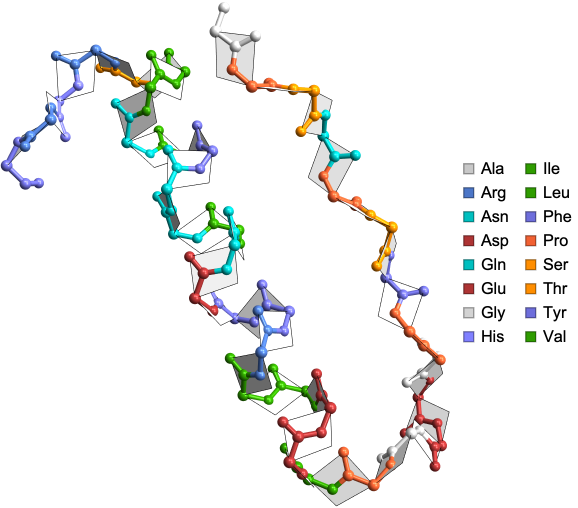
AmidePlanePlot function
AmidePlanePlot function
Visualize the amide planes in the crystal structure of avian pancreatic polypeptide: small globular protein hormone:
In[]:=
AmidePlanePlot["1PPT"]
Out[]=
In[]:=
AmidePlanePlot["1AV1","BackboneAtoms"->False]
Out[]=
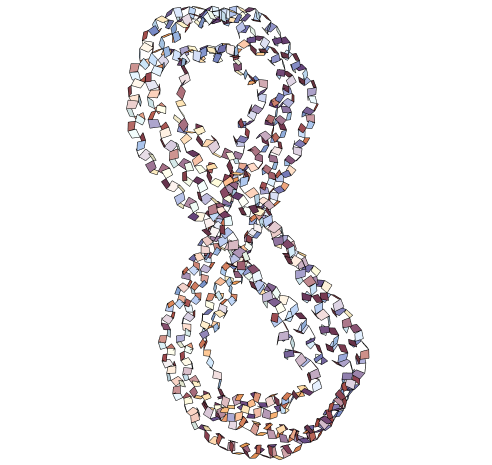
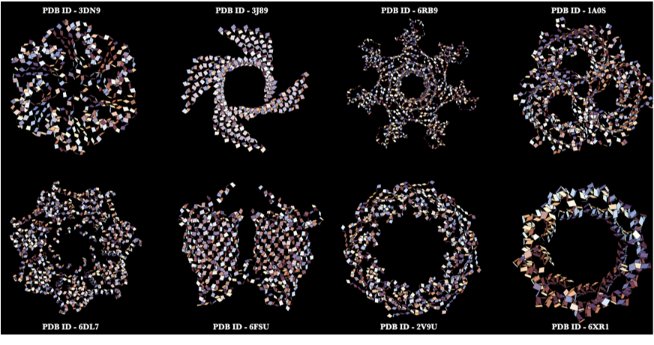
Some elegant amide planes in protein structures created using the AmidePlanePlot function!
Some elegant amide planes in protein structures created using the AmidePlanePlot function!
Better understanding of dihedral angles in proteins using
Better understanding of dihedral angles in proteins using
DihedralAngle with Wolfram
DihedralAngle with Wolfram
In[]:=
Graphics3DStyleHalfPlane[{{0,0,0},{0,1,0}},{1,0,1}],,StyleHalfPlane[{{0,0,0},{0,1,0}},{1,0,0}],,Boxed->False
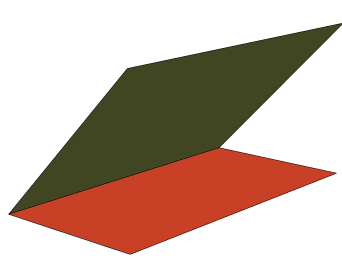
In[]:=
DihedralAngle[{{0,0,0},{0,1,0}},{{1,0,1},{1,0,0}}]
Out[]=
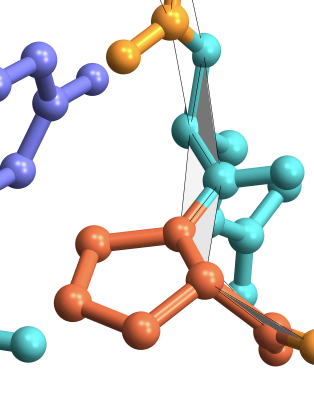
Dihedral Angles in proteins
Dihedral Angles in proteins
Dihedral angles in proteins are formed between planes between the backbone atoms as shown in grey below:
Do more with dihedral angle ({ϕ, ψ}) data in proteins
Do more with dihedral angle ({ϕ, ψ}) data in proteins
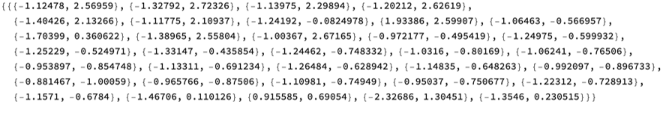
Compute the dihedral angles from the crystal structure of avian pancreatic polypeptide: small globular protein hormone:
Dihedral angles in radians
In[]:=
RamachandranAngles["1PPT"]
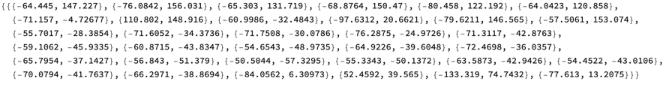
Dihedral angles in degrees
In[]:=
QuantityMagnitude@UnitConvert[Quantity[#,"Radians"],"Degrees"]&/@RamachandranAngles["1PPT"]
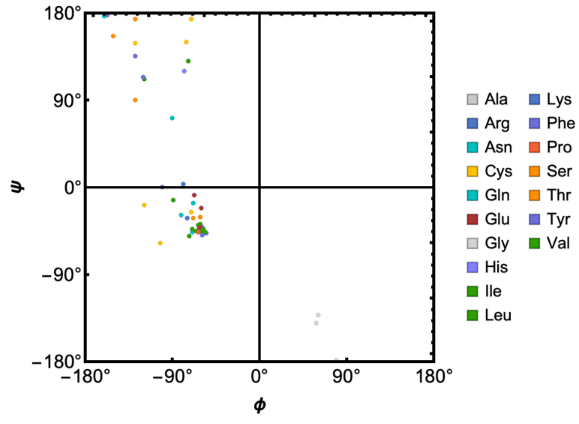
RamachandranPlot function to see dihedral angle distribution
RamachandranPlot function to see dihedral angle distribution
In[]:=
RamachandranPlot["9INS","ResidueColors"->True]
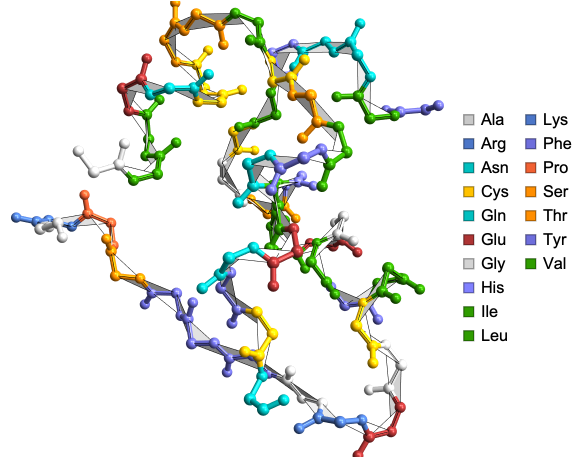
Corresponding DihedralAnglePlot
Corresponding DihedralAnglePlot
In[]:=
DihedralAnglePlot["9INS"]
Out[]=
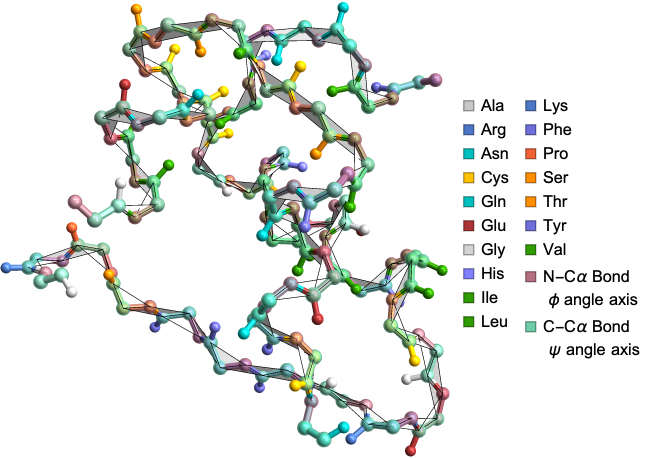
Highlighting the dihedral angle axes
In[]:=
DihedralAnglePlot["9INS","HighlightCCAlphaBond"->True,"HighlightNCAlphaBond"->True]
Out[]=
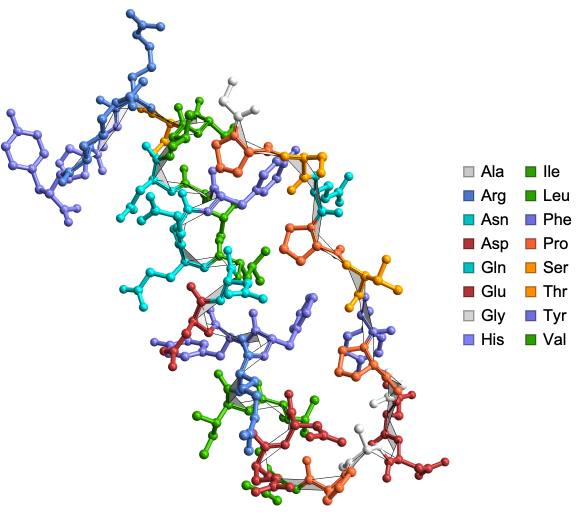
Visualize and analyze the effect of side chains on dihedral angles
In[]:=
DihedralAnglePlot["1PPT","ShowSideChains"->True]
Out[]=
Protein structure analysis for researchers in Wolfram Language
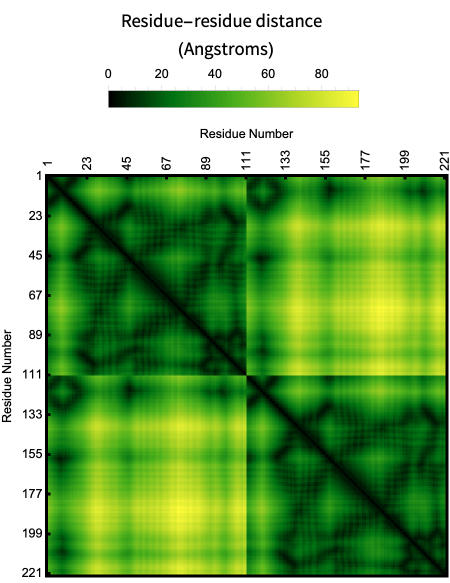
Protein Contact Maps
Protein Contact Maps
Is the map of pairwise distance between residues.
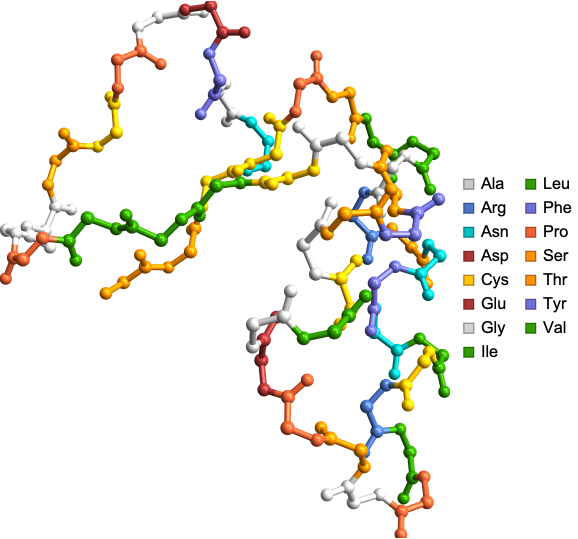
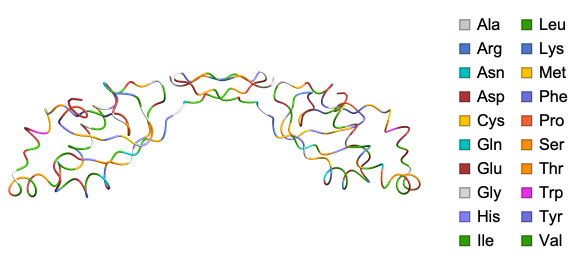
Here is the α-Carbon trace of the structure of the ubiquitin-like domain 1 (Ubl1) of Nsp3 from SARS-CoV-2:
In[]:=
ResourceFunction["BioMoleculePlot3D"]["7KAG","ColorScheme"->"Residue",PlotLegends->True]
ProteinContactMap plots the pairwise residue distance of a protein:
In[]:=
ProteinContactMap["7KAG"]
Out[]=
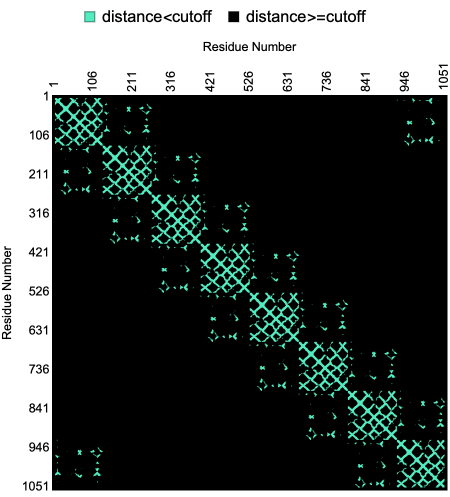
The “CutOff” option for the ProteinContactMap allow users to define cutoff distance between pairs of residues.
Here is a visualization of the contact map of residue distances within a given “CutOff” in the crystal structure of rim domain of the main porin from Mycobacteria smegmatis:
In[]:=
ProteinContactMap"2V9U","CutOff"->Quantity[15,"Angstroms"],"Colors"->,
Out[]=
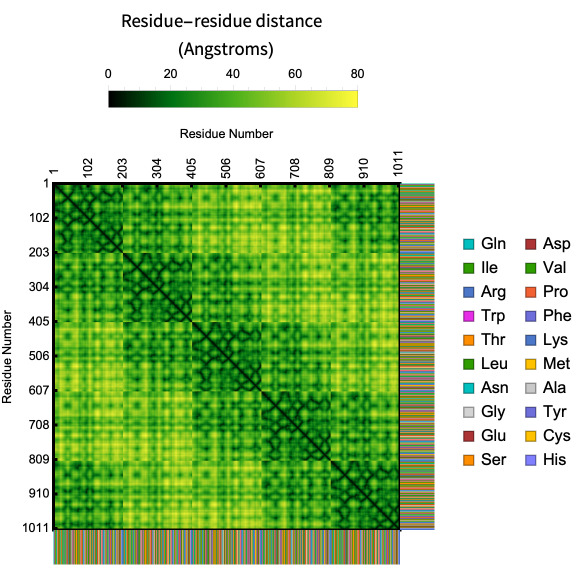
In its basic usage the plot is just a geometric signature of the shape of the backbone but it is possible to create an unique fingerprint of a protein by showing the sequence information along with the contact map.
Here is an example of the contact map of residue distances along with the biomolecule sequence in the crystal structure of AChBP from Bulinus truncatus:
In[]:=
ProteinContactMap["2BJ0","ShowResidues"->True]
Out[]=
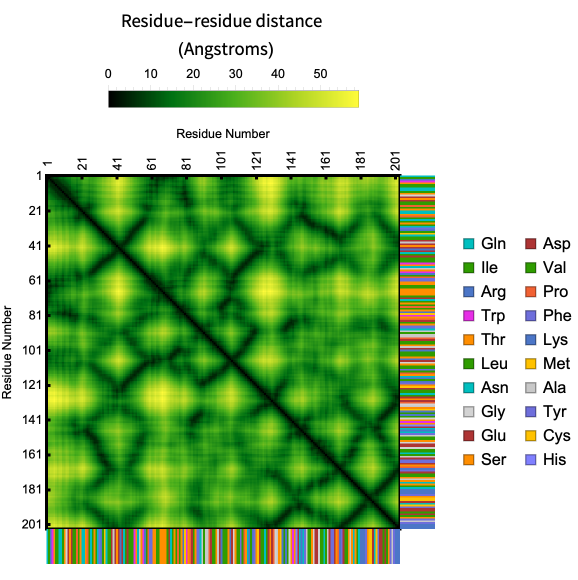
Visualize intra and inter-chain contact maps with “Chains” Option:
Same chain :
In[]:=
ProteinContactMap["2BJ0","ShowResidues"->True,"Chains"->{"A","A"}]
Out[]=
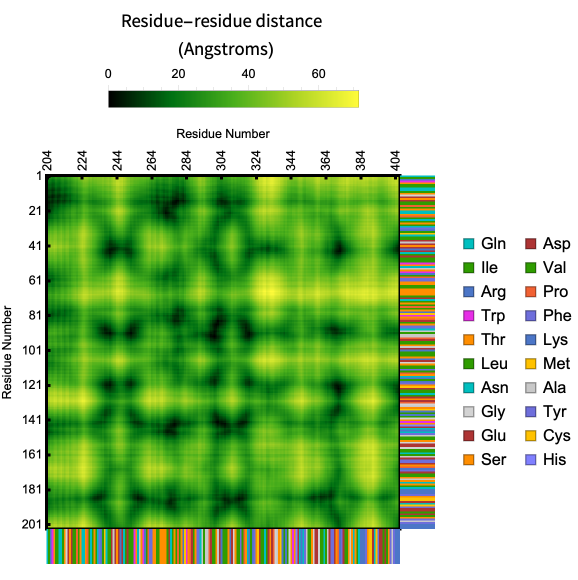
Different chains :
In[]:=
ProteinContactMap["2BJ0","ShowResidues"->True,"Chains"->{"A","B"}]
Out[]=
Do more with the residue-residue distance data
Do more with the residue-residue distance data
In[]:=
resMat=ResidueDistanceMatrix["2BJ0"]//Short
Out[]//Short=

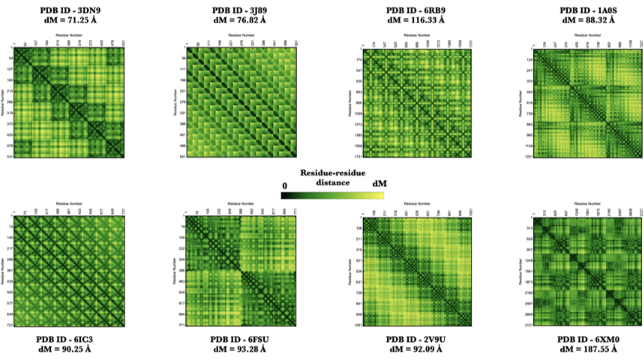
Some elegant contact maps created using the ProteinContactMap function!
Some elegant contact maps created using the ProteinContactMap function!
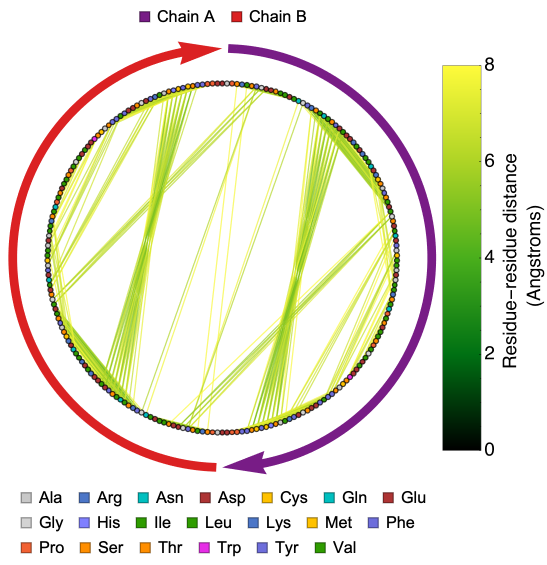
Using graphs to visualize residue-residue interactions in proteins
Using graphs to visualize residue-residue interactions in proteins
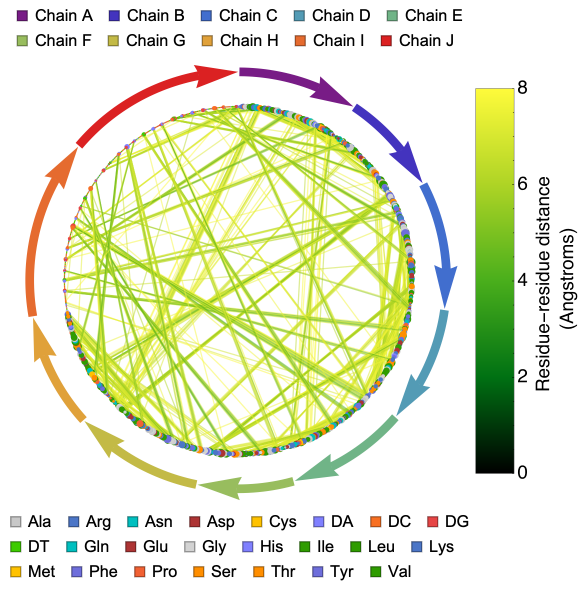
Useful in understanding inter-chain interactions and important residues in a protein. Here is the distance graph of the of the structure of the ubiquitin-like domain 1 (Ubl1) of Nsp3 from SARS-CoV-2:
In[]:=
ProteinContactGraphPlot["7KAG"]
Out[]=
The ProteinContactGraphPlot function includes options that allow users to define the cutoff distance between pairs of residues, set the size of a vertex based on its connectivity, and more. Here is an option to scale the vertex size based on its connectivity.
Here is the distance graph of crystal structure of the nucleosome core particle with scaled vertex size based on its connectivity:
In[]:=
ProteinContactGraphPlot["3LZ0","ScaledVertexSize"->True,VertexSize->15]
Out[]=
Do more with the residue-residue distance graph data
Do more with the residue-residue distance graph data
In[]:=
resGraph=ResidueDistanceGraph["3LZ0"]//EdgeList//Short

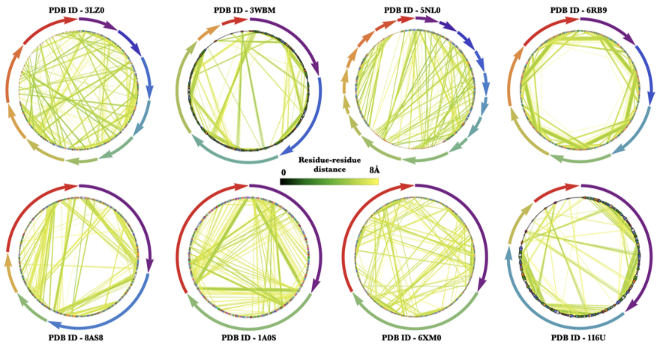
Some elegant contact graphs created using the ProteinContactGraphPlot function!
Some elegant contact graphs created using the ProteinContactGraphPlot function!
Summary
In[]:=
Acknowledgements
Jason Biggs and the Wolfram Alpha Chemistry team!
Useful Resources
◼
Protein Structure Database : RCSB PDB
◼
Instructional Video on protein structure : Protein structure and folding
CITE THIS NOTEBOOK
CITE THIS NOTEBOOK
Wolfram R&D LIVE: visualize protein structures
by Soutick Saha
Wolfram Community, STAFF PICKS, August 2, 2023
https://community.wolfram.com/groups/-/m/t/2982114
by Soutick Saha
Wolfram Community, STAFF PICKS, August 2, 2023
https://community.wolfram.com/groups/-/m/t/2982114