In ballroom dance, footwork is the fundamental aspect that defines the flow, style, and execution of each routine. Each step taken serves as a starting point for a myriad of potential subsequent moves, creating a network of possible steps, culminating in a seamless dance. This intricate network of choices can be effectively represented using the concept of multiway graphs. Multiway graphs expand on the concept of traditional graphs by allowing edges to connect more than two vertices. This flexibility makes multiway graphs to be useful in various applications where relationships among multiple entities need to be modeled simultaneously. In this project, I graphed numerous multiway graphs representing three different ballroom dance styles.
Introduction
Introduction
At the beginning of a dance, dancers often start in a specific stance or position. From this initial position, they can take various steps, each leading to different possible moves. Each step or movement opens up a range of possibilities for the next step. For instance, from a basic step in the waltz, a dancer could transition into a turn, a sway, or another basic step.
Through this project, I discovered many interesting facts about the dances I plotted (the waltz, rumba, and foxtrot). For instance, the waltz, originating in late 18th-century Vienna, Austria, is renowned for its smooth, gliding movements and 3/4 time signature. It introduced close partner dancing, which was considered scandalous at the time. The rumba emerged in Cuba during the late 19th century, blending African rhythms with Spanish melodies. Initially a street dance called “Son,” it evolved into the ballroom version recognized today, characterized by sensual hip movements and a slow-quick-quick rhythm. The foxtrot, developed in the United States in the early 20th century, is often attributed to vaudeville performer Harry Fox, who popularized the dance. With its 4/4 time signature and a mix of slow and quick steps, the foxtrot quickly became a favorite in American ballrooms.
Through this project, I discovered many interesting facts about the dances I plotted (the waltz, rumba, and foxtrot). For instance, the waltz, originating in late 18th-century Vienna, Austria, is renowned for its smooth, gliding movements and 3/4 time signature. It introduced close partner dancing, which was considered scandalous at the time. The rumba emerged in Cuba during the late 19th century, blending African rhythms with Spanish melodies. Initially a street dance called “Son,” it evolved into the ballroom version recognized today, characterized by sensual hip movements and a slow-quick-quick rhythm. The foxtrot, developed in the United States in the early 20th century, is often attributed to vaudeville performer Harry Fox, who popularized the dance. With its 4/4 time signature and a mix of slow and quick steps, the foxtrot quickly became a favorite in American ballrooms.
Graphing Dance Steps
Graphing Dance Steps
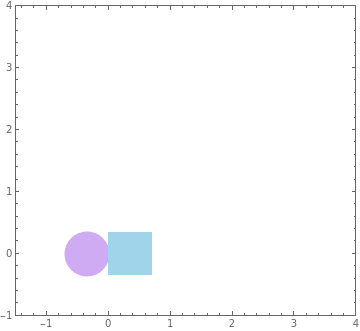
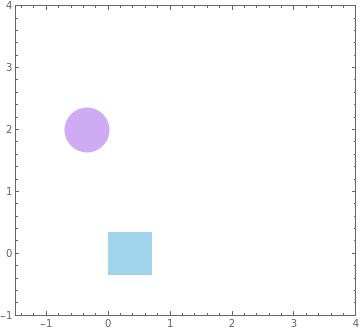
Prior to starting this project, I was very unfamiliar with ballroom dancing. I decided to start with learning the basics of a waltz. I watched an online tutorial that taught several foundational waltz steps, drew diagrams of them on paper, and began plotting each step. I started with the box step, using a purple circle to represent the left foot and a blue square to represent the right foot.
The box step is a fundamental dance pattern that consists of six steps forming a box shape on the floor. Its purpose is to establish basic movement, timing, and rhythm in the waltz. The box step helps dancers develop coordination, balance, and smooth transitions between steps. It is typically one of the first steps taught to beginners because it encapsulates the essence of waltz timing (3/4 time) and movement, making it a foundational element for more complex waltz patterns and routines.
I am plotting the moves of the leader in all of these diagrams and graphs.
In[]:=
Graphics[{Hue[0.75,0.31,0.96],Disk[{-0.35,0},0.35],Hue[0.55,0.32,0.92],Rectangle[{0,-0.35},{0.7,0.35}]},PlotRange->{{-1.5,4},{-1,4}},Frame->True,AspectRatio->Automatic]Graphics[{Hue[0.75,0.31,0.96],Disk[{-0.35,2},0.35],Hue[0.55,0.32,0.92],Rectangle[{0,-0.35},{0.7,0.35}]},PlotRange->{{-1.5,4},{-1,4}},Frame->True,AspectRatio->Automatic]
Out[]=
Out[]=
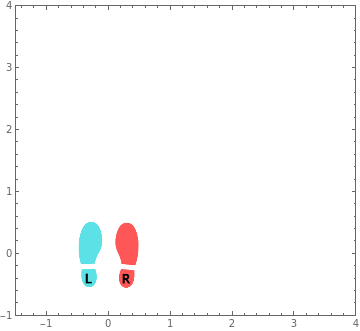
I soon realized that using the Rectangle function would be time-consuming, as it required me to input two sets of coordinates and was generally difficult to control. Additionally, I wanted to replace the circle and rectangle with some icons for better visual appeal. So, I decided to use actual footstep icons.
I started by importing the screenshots of footstep icons from a dance diagram I found online.
I started by importing the screenshots of footstep icons from a dance diagram I found online.
In[]:=
In[]:=
rightF=RemoveBackground
;
In[]:=
In[]:=
leftF=RemoveBackground
;
To ensure that the footstep icons would be the same size on the graph I used the function ImageResize.
In[]:=
rightF=ImageResize
,50
Out[]=
In[]:=
leftF=ImageResize
,50
Out[]=
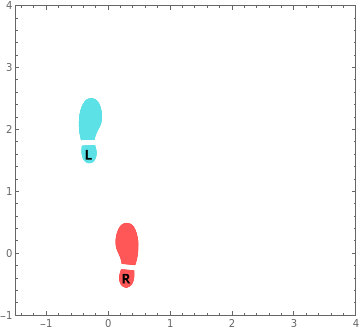
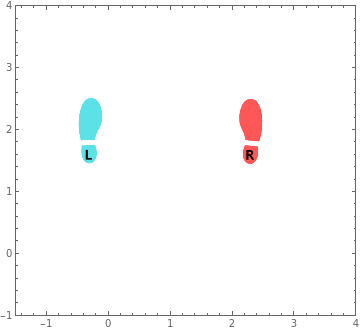
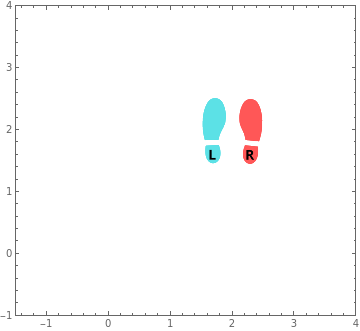
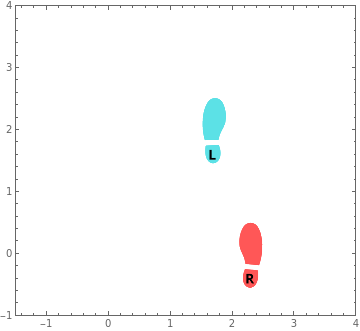
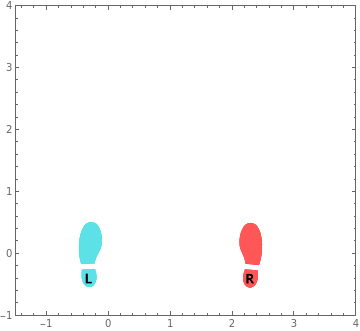
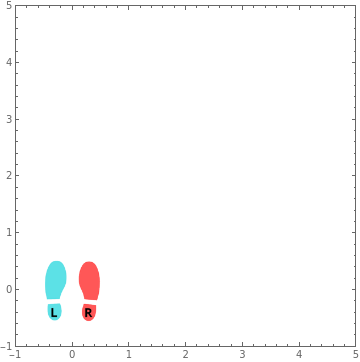
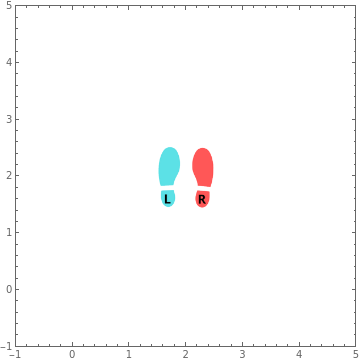
This resizes the footstep icons to be 50 pixels wide. With these new icons, I started plotting the box step again.
This code inserts the ‘leftF’ image at a specified coordinate and the ‘rightF’ image at another specified coordinate, with both images scaled to 0.5 of their original size. The plot range sets the parameters of the coordinate plane from -1.5 to 4 on the x-axis and -1 to 4 on the y-axis, and a frame is added around the graphic. Then, I put these graphs in a row to get a better view of them.
In[]:=
Row[{Graphics[{Inset[leftF,{-0.3,0},Automatic,0.5],Inset[rightF,{0.3,0},Automatic,0.5]},PlotRange->{{-1.5,4},{-1,4}},Frame->True,AspectRatio->Automatic],Graphics[{Inset[leftF,{-0.3,2},Automatic,0.5],Inset[rightF,{0.3,0},Automatic,0.5]},PlotRange->{{-1.5,4},{-1,4}},Frame->True,AspectRatio->Automatic],Graphics[{Inset[leftF,{-0.3,2},Automatic,0.5],Inset[rightF,{2.3,2},Automatic,0.5]},PlotRange->{{-1.5,4},{-1,4}},Frame->True,AspectRatio->Automatic],Graphics[{Inset[leftF,{1.7,2},Automatic,0.5],Inset[rightF,{2.3,2},Automatic,0.5]},PlotRange->{{-1.5,4},{-1,4}},Frame->True,AspectRatio->Automatic],Graphics[{Inset[leftF,{1.7,2},Automatic,0.5],Inset[rightF,{2.3,0},Automatic,0.5]},PlotRange->{{-1.5,4},{-1,4}},Frame->True,AspectRatio->Automatic],Graphics[{Inset[leftF,{-0.3,0},Automatic,0.5],Inset[rightF,{2.3,0},Automatic,0.5]},PlotRange->{{-1.5,4},{-1,4}},Frame->True,AspectRatio->Automatic],Graphics[{Inset[leftF,{-0.3,0},Automatic,0.5],Inset[rightF,{0.3,0},Automatic,0.5]},PlotRange->{{-1.5,4},{-1,4}},Frame->True,AspectRatio->Automatic]}]
Out[]=
Defining the Function
Defining the Function
To create the multiway graph, I defined a function called displayGraph that would graph the dance steps once I input the coordinates of the footstep icons.
Module is used to help create local variables, leftF and rightF, and Inset places a foot icon image (leftF or rightF) at a position specified by leftandrightFootCoor. Part is used to take the first half of the input and save it as the coordinates for the left foot; it also takes the last half of the input and saves it as the coordinates for the right foot.
Module is used to help create local variables, leftF and rightF, and Inset places a foot icon image (leftF or rightF) at a position specified by leftandrightFootCoor. Part is used to take the first half of the input and save it as the coordinates for the left foot; it also takes the last half of the input and saves it as the coordinates for the right foot.
In[]:=
displayGraph[leftandrightFootCoor_]:=ModuleleftF=ImageResize
,50,rightF=ImageResize
,50,Graphics[{Inset[leftF,Part[leftandrightFootCoor,1],Automatic,0.5],Inset[rightF,Part[leftandrightFootCoor,2],Automatic,0.5]},PlotRange->{{-1,5},{-1,5}},Frame->True,AspectRatio->Automatic]
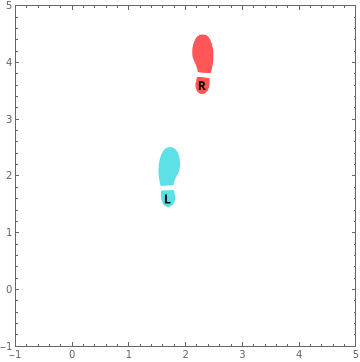
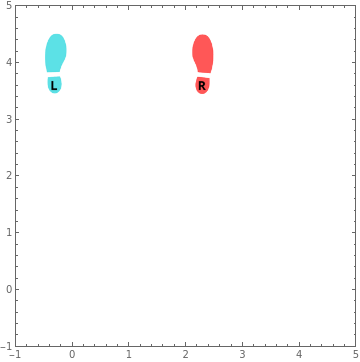
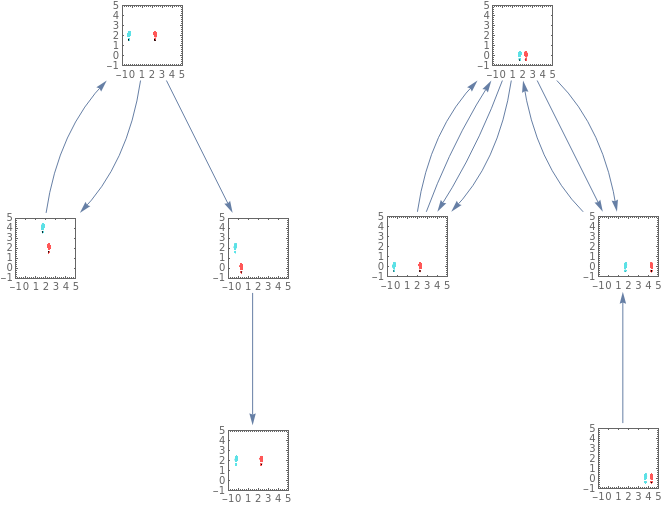
I used this function to graph the hesitation waltz step and the progressive step respectively. The hesitation step is used to momentarily pause the forward progression of the dance. It adds dramatic effect and allows dancers to emphasize musical phrasing, align themselves with the beat, or prepare for a change in direction or pattern. On the other hand, the progressive step drives the dance forward in a smooth, continuous motion. It involves a series of forward or backward steps, maintaining the characteristic rise and fall motion of the waltz, and helps create the graceful movement of the dance.
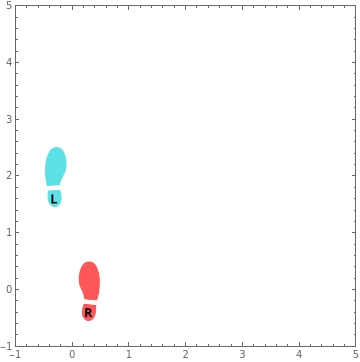
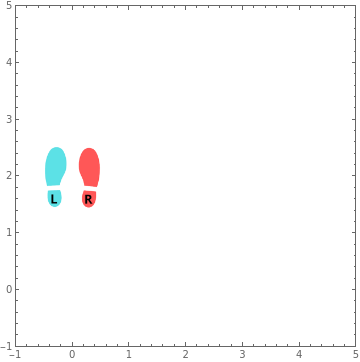
Here I mapped the function displayGraph across the set of coordinates that make up the hesitation and progressive step.
Here I mapped the function displayGraph across the set of coordinates that make up the hesitation and progressive step.
In[]:=
Row[displayGraph/@{{{-0.3,0},{0.3,0}},{{-0.3,2},{0.3,0}},{{-0.3,2},{0.3,2}}}]
Out[]=
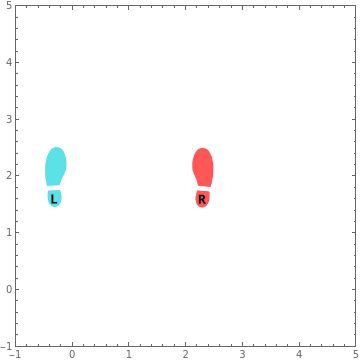
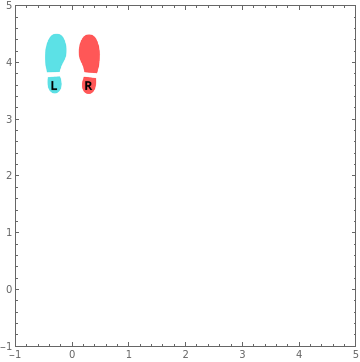
In[]:=
Row[displayGraph/@{{{-0.3,0},{0.3,0}},{{-0.3,2},{0.3,0}},{{-0.3,2},{2.3,2}},{{1.7,2},{2.3,2}},{{1.7,2},{2.3,4}},{{-0.3,4},{2.3,4}},{{-0.3,4},{0.3,4}}}]
Out[]=
Creating the Multiway Graphs
Creating the Multiway Graphs
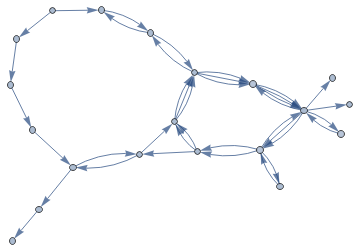
To create the actual multiway graph, I used the functions Graph and DirectedEdge. The function DirectedEdge creates a directed edge () between the first and second set of coordinates, and VertexShapeFunction customizes how each vertex (node) in the graph is displayed. Inset places a graph created by (displayGraph[val]) at each vertex position so that each vertex is represented by its own small graph.
I used Iconize to organize my coordinate points .
In[]:=
waltzEdges=;
Apply[DirectedEdge, waltzEdges, 1] applies the DirectedEdge function to all the elements in waltzEdges at the first level, meaning that DirectedEdge is applied to each sublist within waltzEdges.
In[]:=
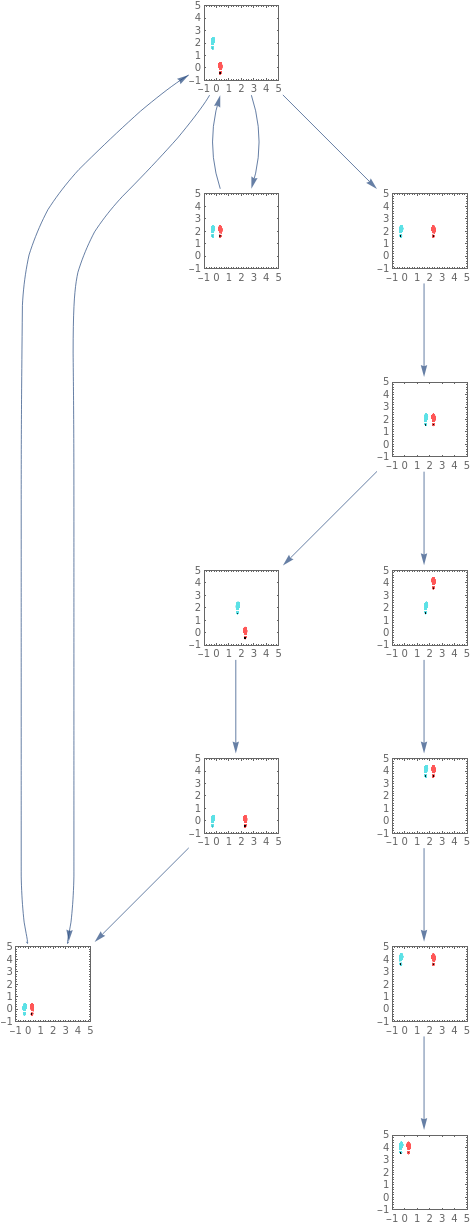
waltzSteps=Graph[Apply[DirectedEdge,waltzEdges,1],VertexShapeFunction->Function[{off,val,scale},Inset[displayGraph[val],off,Automatic,First[scale]]],VertexSize->1,PerformanceGoal->"Quality",AspectRatio->Automatic,GraphLayout->"LayeredDigraphEmbedding"]
Out[]=
Then, I plotted the three steps in the foxtrot dance: the foxtrot basic step (forward and backward), the box step, and the feather step. I chose to graph the foxtrot because my research indicated that it is one of the ballroom dances most similar to the waltz. Both dances share a smooth, gliding motion and emphasize fluidity and elegance in their steps. Additionally, they both follow structured patterns and timing, making them comparable in style and technique.
The basic step establishes the rhythm and movement pattern of the dance. Forward and backward steps help dancers maintain smooth, continuous motion across the floor, setting the foundation for more complex patterns. The box step is a fundamental movement in ballroom dancing. In the foxtrot, it provides a structured, repeating pattern that helps dancers maintain their timing and position on the dance floor, allowing for controlled and precise movements. The feather step is a signature move in the foxtrot, characterized by its smooth, gliding motion. It adds elegance and fluidity to the dance, enabling the dancers to travel across the floor with grace while maintaining the characteristic slow-quick-quick rhythm of the foxtrot.
The basic step establishes the rhythm and movement pattern of the dance. Forward and backward steps help dancers maintain smooth, continuous motion across the floor, setting the foundation for more complex patterns. The box step is a fundamental movement in ballroom dancing. In the foxtrot, it provides a structured, repeating pattern that helps dancers maintain their timing and position on the dance floor, allowing for controlled and precise movements. The feather step is a signature move in the foxtrot, characterized by its smooth, gliding motion. It adds elegance and fluidity to the dance, enabling the dancers to travel across the floor with grace while maintaining the characteristic slow-quick-quick rhythm of the foxtrot.
In[]:=
foxtrotEdges=;
Apply[DirectedEdge, foxtrotEdges, {1}] converts each sublist in foxtrotEdges into a DirectedEdge, representing the sequence of steps. EdgeTaggedGraph is used instead of a standard Graph because it allows multiple edges between the same vertices. This is crucial for representing different dance steps that may share the same starting and ending positions but are part of different movements. GraphLayout -> “LayeredEmbedding” arranges the vertices in a layered structure, which is suitable for showing the progression of dance steps.
In[]:=
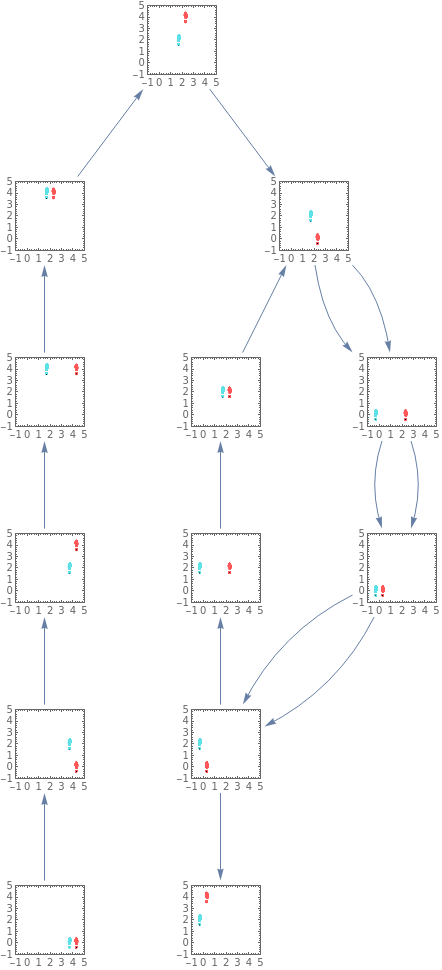
foxtrotSteps=EdgeTaggedGraph[Apply[DirectedEdge,foxtrotEdges,{1}],VertexShapeFunction->Function[{off,val,scale},Inset[displayGraph[val],off,Automatic,First[scale]]],VertexSize->1,PerformanceGoal->"Quality",AspectRatio->Automatic,GraphLayout->"LayeredEmbedding"]
Out[]=
Merging the Graphs
Merging the Graphs
I aimed to merge the two graphs to analyze any commonalities between the two ballroom dance styles. For instance, the Waltz and the Foxtrot have distinct characteristics but also share some overlapping steps. To facilitate this, I assigned the moves of dances created above to two variables: `foxtrotSteps` and `waltzSteps` and proceeded to combine the two graphs.
In[]:=
GraphUnion[foxtrotSteps,waltzSteps]
Out[]=
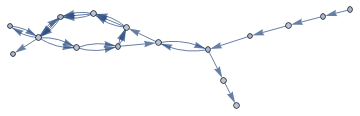
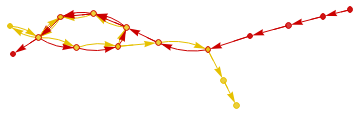
After merging the graphs of the waltz steps and the foxtrot steps, I used `HighlightGraph` to emphasize the individual paths of the two dance styles. By using different colors, you can see how they overlap (have similar dance steps) and where they differ. In this graph, the red edges represent the Foxtrot, and the yellow edges represent the Waltz .
In[]:=
HighlightGraph[%,{foxtrotSteps,waltzSteps}]
Out[]=
Next, I plotted the underarm turn, cucaracha, and side step of rumba.
The underarm turn adds flair and dynamic movement to the dance while highlighting the dancers’ partnership and coordination. It allows the follower to showcase their spins and turns, enhancing the visual appeal and complexity of the routine. It also provides a moment for the leader to display control and precision in guiding the follower. The cucaracha step is an essential move in rumba, and is characterized by a side-to-side motion. It helps dancers practice weight transfer and hip action, which is a fundamental aspect of Latin dance. Next, the side step is crucial for maintaining the dance’s structure and rhythm. It facilitates smooth transitions between moves and helps dancers cover more space on the dance floor. The side step also emphasizes characteristic hip movements that define the rumba and its sensual style.
The underarm turn adds flair and dynamic movement to the dance while highlighting the dancers’ partnership and coordination. It allows the follower to showcase their spins and turns, enhancing the visual appeal and complexity of the routine. It also provides a moment for the leader to display control and precision in guiding the follower. The cucaracha step is an essential move in rumba, and is characterized by a side-to-side motion. It helps dancers practice weight transfer and hip action, which is a fundamental aspect of Latin dance. Next, the side step is crucial for maintaining the dance’s structure and rhythm. It facilitates smooth transitions between moves and helps dancers cover more space on the dance floor. The side step also emphasizes characteristic hip movements that define the rumba and its sensual style.
In[]:=
rumbaEdges=;
In[]:=
rumbaSteps=Graph[Apply[DirectedEdge,rumbaEdges,{1}],VertexShapeFunction->Function[{off,val,scale},Inset[displayGraph[val],off,Automatic,First[scale]]],VertexSize->1,PerformanceGoal->"Quality",AspectRatio->Automatic,GraphLayout->"LayeredEmbedding"]
Out[]=
After mapping out the dance steps for the rumba, I used GraphUnion to merge these rumba steps with those of the waltz and foxtrot, then assigned the result to the variable legendGraph.
I used HighlightGraph to mark each of the different dance styles in a distinct order.
In[]:=
legendGraph=GraphUnion[foxtrotSteps,waltzSteps,rumbaSteps]
Out[]=
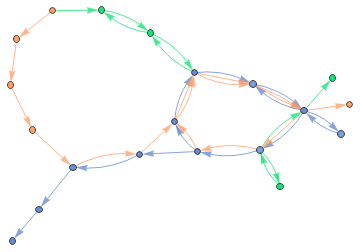
HighlightGraph takes legendGraph as the base graph and highlights specific parts in different colors : rumbaSteps in bright green, foxtrotSteps in orange, and waltzSteps in light blue . SwatchLegend creates a legend for the graph using these same colors and labels them as “Rumba,” “Foxtrot,” and “Waltz,” setting the font for the labels to “Alegreya SC.” The Legended function then combines the highlighted graph with the legend .
Creating a highlighted graph for rumba foxtrot and waltz.
In[]:=
Legended[HighlightGraph[legendGraph,{Style[rumbaSteps,Hue[0.41,1.,0.88]],Style[foxtrotSteps,Hue[0.06,0.64,1]],Style[waltzSteps,Hue[0.61,0.59,0.82]]}],SwatchLegend[{Hue[0.41,1.,0.88],Hue[0.06,0.64,1],Hue[0.61,0.59,0.82]},{"Rumba","Foxtrot","Waltz"},LabelStyle{FontFamily"Alegreya SC"}]]
Out[]=
I wanted music that corresponds to that certain dance style to be played once the name of the style was clicked on so I used the Button and EmitSound function so that the names of the style of dances would be changed into a button that emits the appropriate audio.
To play the demonstration, click on the play button located at the lower left corner.
To play the demonstration, click on the play button located at the lower left corner.
Analyzing Ballroom Dances at a Broader Level
Analyzing Ballroom Dances at a Broader Level
I had some extra time so I decided to compare different style of ballroom dance on a broader level. I decided to compare their place of origin, time period of origin, defining characteristics, and the instrumentals used in the dance’s specific music. I gathered this data from researching ballroom dances online and put the information into a dataset.
In the beginning, I organized the information using the dataset function.
In the beginning, I organized the information using the dataset function.
In[]:=
ballroomDanceData=Dataset
Out[]=
However, I realized that using the Dataset function was not the best decision for this particular use case. While Datasets can be powerful for some types of data manipulation, they can make it more difficult to directly access specific keys and compare elements. By keeping the data in a simple nested association structure, more flexibility is maintained for observing similarities and differences between dance styles. Using the nested association structure allows for easier addition or modification of dance styles without changing the overall structure. When information is formatted this way, specific dance styles are able to be accessed directly by key (e.g., ballroomDanceData[“Style1”]). This way, it’s easier to perform nested queries on associations, which is useful for complex comparisons between dance styles. The association structure allows you to add custom keys (like “Style1”) which can be useful for ordering or categorizing the data. Associations work well with many built-in Wolfram Language functions without needing to convert to other data structures. New properties can be added to individual dance styles without affecting others.
In[]:=
ballroomDanceData=<|"Style1"-><|"Name"->"Waltz","Origin"->"Austria","Period"->"Late 18th century","Characteristics"->{"3/4 time","Rotating","Smooth"},"Instruments"->{"Piano","Violin","Cello"}|>,"Style2"-><|"Name"->"Foxtrot","Origin"->"United States","Period"->"Early 20th century","Characteristics"->{"4/4 time","Smooth","Progressive"},"Instruments"->{"Saxophone","Trumpet","Piano"}|>,"Style3"-><|"Name"->"Tango","Origin"->"Argentina","Period"->"Late 19th century","Characteristics"->{"2/4 time","Sharp","Dramatic"},"Instruments"->{"Bandoneon","Violin","Piano","Guitar"}|>,"Style4"-><|"Name"->"Quickstep","Origin"->"United States","Period"->"Early 20th century","Characteristics"->{"4/4 time","Fast","Energetic"},"Instruments"->{"Trumpet","Saxophone","Drums"}|>,"Style5"-><|"Name"->"Viennese waltz","Origin"->"Austria","Period"->"Late 18th century","Characteristics"->{"3/4 time","Fast","Rotating","Smooth"},"Instruments"->{"Violin","Piano","Cello"}|>,"Style6"-><|"Name"->"Rumba","Origin"->"Cuba","Period"->"Early 20th century","Characteristics"->{"4/4 time","Slow","Hip movements"},"Instruments"->{"Conga","Bongos","Maracas","Guitar"}|>|>;
The keys in `ballroomDanceData` are “Style1”, “Style2”, etc., each representing a different dance style. Each style is an association with keys for “Name”, “Origin”, “Period”, “Characteristics”, and “Instruments”. The query `Query[All, “Origin”]` is designed to extract the “Origin” field from every element in the dataset. When applied to `ballroomDanceData`, it retrieves the “Origin” information for all dance styles. This is repeated for the instruments, characteristics, and time period.
In[]:=
originTEST=Query[All,"Origin"][ballroomDanceData];instruTEST=Query[All,"Instruments"][ballroomDanceData];charTEST=Query[All,"Characteristics"][ballroomDanceData];periodTEST=Query[All,"Period"][ballroomDanceData];
Essentially, this code is creating a list of edges for a graph. Each edge represents a connection between two dance styles that share at least one instrument. The edges are styled in purple and are undirected (meaning the connection goes both ways).
The code iterates over all keys in `instruTEST`, initializes an empty list for each style, and creates `lessTMP` by dropping the current style’s key. If an intersection exists between two dance styles, a purple undirected edge is added to `connectionLST`. This process is applied to all keys in `lessTMP`, then the list is flattened and duplicates are removed.
In[]:=
instruEdges=Table[connectionLST={};With[{lessTMP=KeyDropFrom[instruTEST,"style"]},If[IntersectingQ[instruTEST[style],instruTEST[#]],AppendTo[connectionLST,Style[UndirectedEdge[style,#],Purple]],Nothing]&/@Keys[lessTMP]],{style,Keys@instruTEST}]//Flatten//DeleteDuplicates;
In[]:=
charEdges=Table[connectionLST={};With[{lessTMP=KeyDropFrom[charTEST,"style"]},If[IntersectingQ[charTEST[style],charTEST[#]],AppendTo[connectionLST,Style[UndirectedEdge[style,#],Red]],Nothing]&/@Keys[lessTMP]],{style,Keys@instruTEST}]//Flatten//DeleteDuplicates;
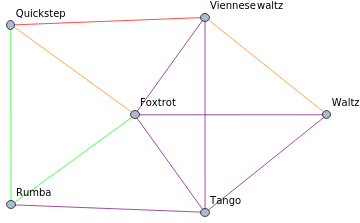
For the musical instruments and characteristics, I used the function IntersectingQ because there were multiple qualities inside the Keys and so if the dances shared one instrument or one of the same characteristics, an undirected edge would be drawn in between them. But for the origin and time period, I used the function StringMatchQ because the keys only had one quality.
In[]:=
originEdges=Table[connectionLST={};With[{lessTMP=KeyDropFrom[originTEST,"style"]},If[StringMatchQ[originTEST[style],originTEST[#]],AppendTo[connectionLST,Style[UndirectedEdge[style,#],Orange]],Nothing]&/@Keys[lessTMP]],{style,Keys[originTEST]}]//Flatten//DeleteDuplicates;
In[]:=
periodEdges=Table[connectionLST={};With[{lessTMP=KeyDropFrom[periodTEST,"style"]},If[StringMatchQ[periodTEST[style],periodTEST[#]],AppendTo[connectionLST,Style[UndirectedEdge[style,#],Green]],Nothing]&/@Keys[lessTMP]],{style,Keys[originTEST]}]//Flatten//DeleteDuplicates;
I used the function Join to combine all the graphs and let the vertex labels equal the name of the ballroom dance style.
In[]:=
Graph[Join[originEdges,instruEdges,periodEdges,charEdges],VertexLabels((#ballroomDanceData[#,"Name"])&/@Keys[ballroomDanceData])]
Out[]=
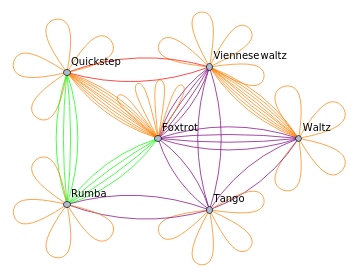
To avoid extra overlaps between the vertices and to ensure that the vertices don’t loop and connect to themselves, I used the SimpleGraph function instead of the Graph function.
Used SimpleGraph to remove self-loops and overlaps.
In[]:=
SimpleGraph[Join[originEdges,instruEdges,periodEdges,charEdges],VertexLabels((#ballroomDanceData[#,"Name"])&/@Keys[ballroomDanceData])]
Out[]=
Extensions
Extensions
Some possible extensions include:
◼
Use community detection algorithms to identify common patterns or motifs within and between different dances.
◼
Integrate musical features (e.g., rhythm, tempo, and dynamics) with dance movements to analyze how music influences the structure of the dance multigraphs.
◼
Train machine learning models to classify different types of ballroom dances based on their multigraph representations.
◼
Use predictive modeling to forecast the next steps or sequences in a dance based on the current state of the multigraph.
◼
Investigate how ballroom dances have evolved over time by comparing historical and contemporary multigraphs.
References
References
◼
Encyclopedia Britannica, inc. (n.d.). Waltz. Encyclopedia Britannica. https://www.britannica.com/art/waltz
◼
Foxtrot. Ballroom Dance Academy. (2019, April 30). https://ballroomdanceacademyla.com/the-dances/descriptions-of-dances/foxtrot/
◼
Insanity, D. (2018, August 7). Basic rumba top ten steps & routine. YouTube. https://www.youtube.com/watch?v=rrlq0FnXmhE&ab_channel=DanceInsanity
◼
Rumba. Bella Ballroom. (2019, May 6). https://www.bellaballroom.com/dance-lessons/latin-dance/rumba/
◼
Social Dance Online. (2022a, October 10). The 7 best beginner waltz dance steps!. YouTube. https://www.youtube.com/watch?v=-ewZ4bWRkVo&t=654s&ab_channel=SocialDanceOnline
◼
Social Dance Online. (2022b, October 30). Learn 7 foxtrot steps for beginners. YouTube. https://www.youtube.com/watch?v=RYWZYILLxfI&t=96s&ab_channel=SocialDanceOnline
Acknowledgements
Acknowledgements
I would like to thank my mentors CJ Applebaum and Macy Levin for guiding me through this project. I would also like to thank Andrea Li, Logan Gilbert, Megan Davis, and the program directors for all their help.
CITE THIS NOTEBOOK
CITE THIS NOTEBOOK
Creating multiway graphs of dances
by Tianning Li
Wolfram Community, STAFF PICKS, July 12, 2024
https://community.wolfram.com/groups/-/m/t/3216748
by Tianning Li
Wolfram Community, STAFF PICKS, July 12, 2024
https://community.wolfram.com/groups/-/m/t/3216748