Introducing the Wolfram ProteinVisualization paclet! Delve into the fascinating world of biomolecular structures with this state-of-the-art tool. Designed for researchers, educators, and structural biology enthusiasts alike, our paclet offers an immersive experience for visualizing the intricate structures of biomolecules, including proteins, nucleic acids, and their complexes. Explore the elegant geometry of molecular backbones, amide planes, and more with captivating 3D graphics. Go deeper into the world of structural biology by computing and visualizing key features such as contact maps and dihedral angles. Whether you’re analyzing protein structures, studying nucleic acid interactions, or simply marveling at the beauty of nature’s molecular machines, our paclet empowers you to see biomolecules in a new light. Experience the wonder of biomolecular visualization - get started with our paclet today!
Here are some examples of how different functions in the paclet can be used to visualize numerous aspects of protein structure.
Visualizations with the paclet
Visualizations with the paclet
Install the paclet
Install the paclet
To install this paclet in your Wolfram Language environment, evaluate this code:
In[]:=
PacletInstall["WolframChemistry/ProteinVisualization"]
Out[]=
To load the code after installation, evaluate this code:
In[]:=
Needs["WolframChemistry`ProteinVisualization`"]
ProteinBackboneAtomPlot
ProteinBackboneAtomPlot
ProteinBackboneAtomPlot generates a customizable 3D plot of the backbone atoms and bonds in a protein or protein-nucleic acid complex, with options to include side chains, display residue or atom information, and color-code chains, atoms, or residues for enhanced visualization.
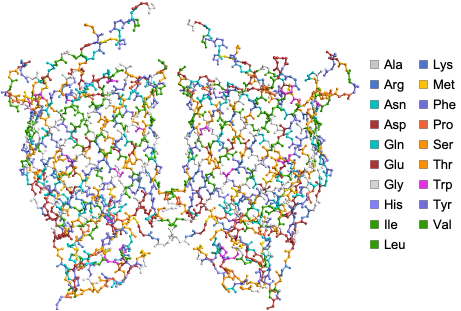
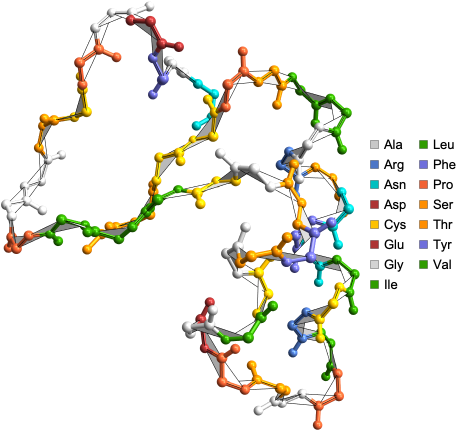
Visualize the structure of E.coli BamA beta-barrel protein where atoms are color coded by amino acids using the ProteinBackboneAtomPlot function:
In[]:=
ProteinBackboneAtomPlot["6FSU"]
Out[]=
Options for the ProteinBackboneAtomPlot function allows users to define different PlotThemes and color residues by amino acids or chains or atoms and do much more (For full list of Options see - https://resources.wolframcloud.com/PacletRepository/resources/WolframChemistry/ProteinVisualization/ref/ProteinBackboneAtomPlot.html ).
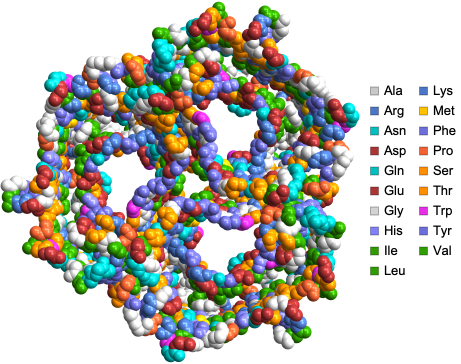
We can visualize the structure of sucrose-specific porin ScrY from Salmonella typhimurium using the “SpaceFilling” PlotTheme:
In[]:=
ProteinBackboneAtomPlot["1A0S",PlotTheme->"SpaceFilling"]
Out[]=
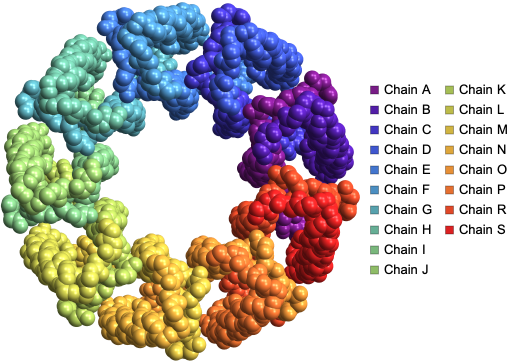
We can visualize the structure of LH2 from Rps. acidophila using by color coding atoms by chains using the “BackboneColorRules” Option:
In[]:=
ProteinBackboneAtomPlot["2FKW",PlotTheme->"SpaceFilling","BackboneColorRules"->{"Chains",Automatic}]
Out[]=
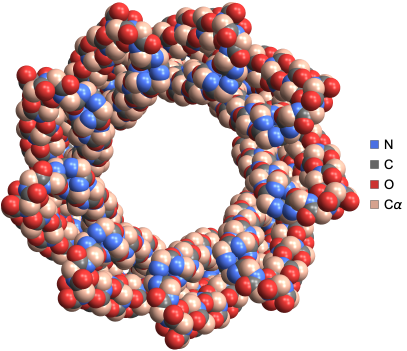
We can visualize the structure of computationally designed right-handed alpha/alpha single-chain toroid with 9 repeats using by color coding atoms by atom type
and specifying color for the α-Carbon atom:
and specifying color for the α-Carbon atom:
In[]:=
ProteinBackboneAtomPlot"6XR1",PlotTheme->"SpaceFilling","BackboneColorRules"->"Atoms","Cα"->
Out[]=
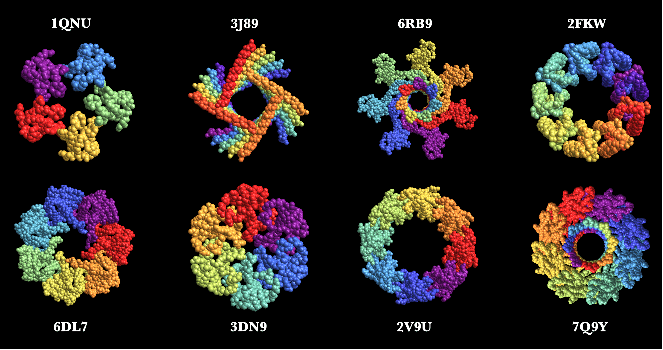
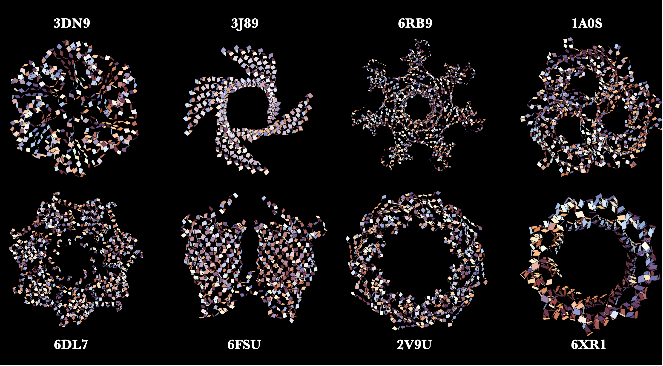
Here are some neat examples of protein structures with their four letter PDB IDs created using the ProteinBackboneAtomPlot function where the proteins are color-coded by chains:
AmidePlanePlot
AmidePlanePlot
AmidePlanePlot generates a 3D visualization of the amide planes along with the backbone atoms in a protein or protein-nucleic acid complex, highlighting the planar geometry of peptide bonds. This can be a great tool for educators to explain complex structural biology concepts to students when combined with the Options of ProteinBackboneAtomPlot.
Here is the visualization of amide planes for the crystal structure of insulin with five atoms from adjacent residues lying in the same amide plane:
In[]:=
AmidePlanePlot["9INS"]
Out[]=
It is also possible to only visualize the amide planes of the proteins using the “BackboneAtoms” Option. Here is an example of visualization of only the amide planes of truncated human apolipoprotein A-I:
In[]:=
AmidePlanePlot["1AV1","BackboneAtoms"->False]
Out[]=
Here are some neat examples showing only the amide planes of protein structures with their four letter PDB IDs created using the AmidePlanePlot function:
DihedralAnglePlot
DihedralAnglePlot
DihedralAnglePlot generates a 3D visualization of protein backbones, highlighting the planes that form dihedral angles ϕ and ψ, and provides interactive residue information and dihedral angle values upon mouse hover. This is another great visualization tool specifically created for educators to explain what gives rise to dihedral angles, a complex but extremely important aspect of the protein structure. This can be combined with the function RamachandranPlot to have a holistic idea about the constraints in the possible allowable dihedral angle pairs ({ϕ, ψ}) in proteins.
Here is the dihedral angle plot for the crystal structure of crambin:
In[]:=
DihedralAnglePlot["1CRN"]
Out[]=
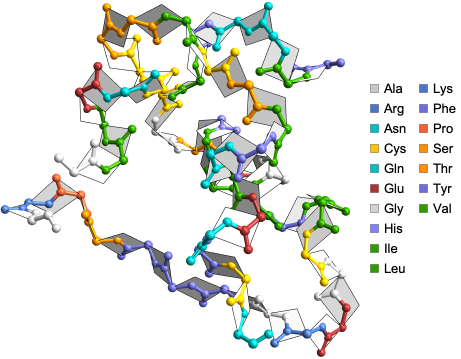
Here are some neat examples of protein backbones along with the planes that form dihedral angles ϕ and ψ, with their four letter PDB IDs created using the DihedralAnglePlot function where the proteins are color-coded by amino acid residues:
ProteinContactMap
ProteinContactMap
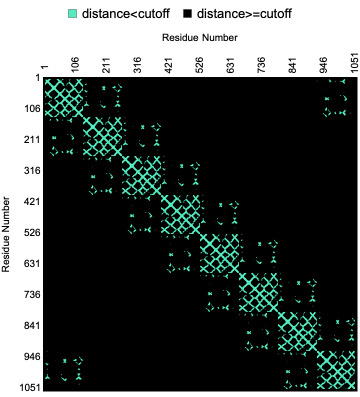
ProteinContactMap creates a customizable contact map for a protein, nucleic acid, or protein-nucleic acid complex, displaying residue-residue interactions, with options to set the cutoff distance of interactions, display sequence information, define color schemes and more. This function combined with its options can be used to understand the geometric signatures of different classic protein structure classes like beta barrel, coiled coil and so on.
Here is a visualization of the contact map of residue distances in the crystal structure of protein-RNA complex:
In[]:=
ProteinContactMap["3WBM"]
Out[]=
Options for the ProteinContactMap allow users to define cutoff distance between pairs of residues, show the biomolecule sequence along with the contact map and more (For full list of Options see - https://resources.wolframcloud.com/PacletRepository/resources/WolframChemistry/ProteinVisualization/ref/ProteinContactMap.html ).
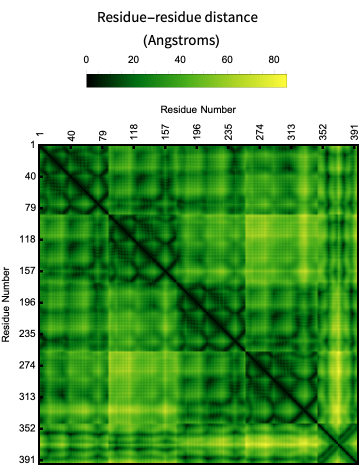
Here is a visualization of the contact map of residue distances within a given “CutOff” in the crystal structure of rim domain of the main porin from Mycobacteria smegmatis:
In[]:=
ProteinContactMap"2V9U","CutOff"->Quantity[15,"Angstroms"],"Colors"->,
Out[]=
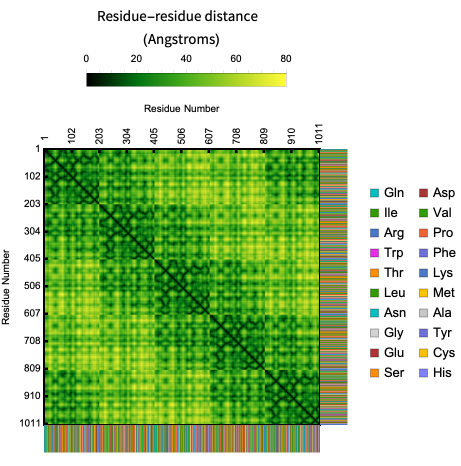
In its basic usage the plot is just a geometric signature of the shape of the backbone but it is possible to create an unique fingerprint of a protein by showing the sequence information along with the contact map. Here is an example of the contact map of residue distances along with the biomolecule sequence in the crystal structure of AChBP from Bulinus truncatus:
In[]:=
ProteinContactMap["2BJ0","ShowResidues"->True]
Out[]=
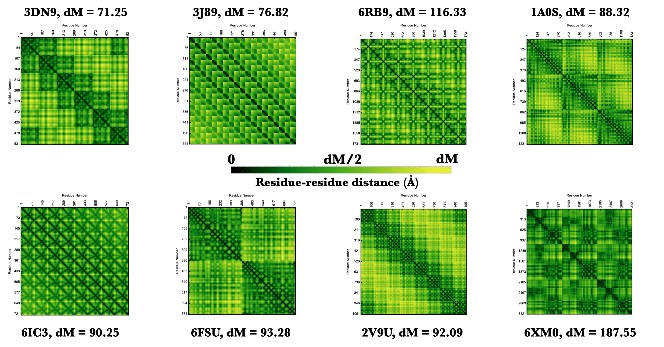
Here are some neat examples of contact maps of proteins with their four letter PDB IDs created using the ProteinContactMap function:
ProteinContactGraphPlot
ProteinContactGraphPlot
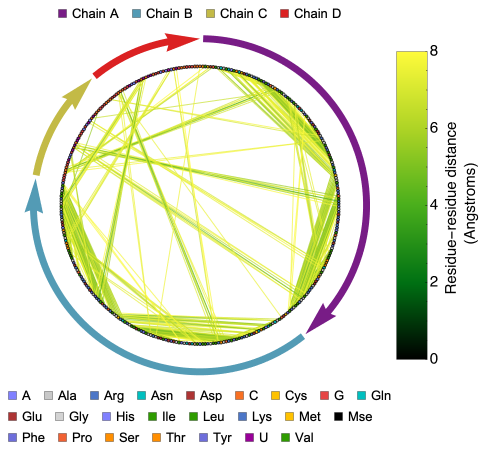
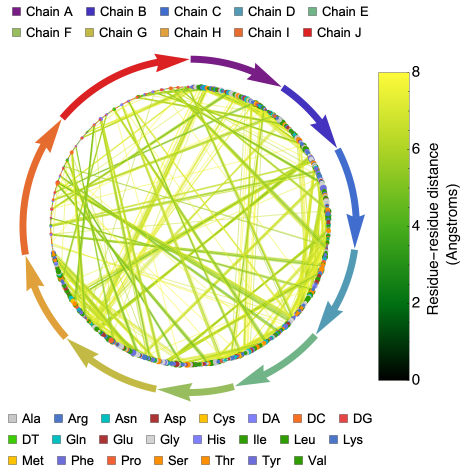
ProteinContactGraphPlot generates a circular graph of protein or protein-nucleic acid complex residues. In this graph, nodes represent residues and edges represent interactions within a customizable ‘CutOff’ distance. The nodes and edges are color-coded for residue type and interaction distance, and there are options to highlight specific interactions, adjust node sizes, and more.
This function provides a more information-rich version of the ResidueDistanceGraph, which generates an undirected graph connecting nearby nodes (residues of the biomolecule) with mono-colored edges. While ResidueDistanceGraph gives an idea of the overall topology of the protein structure without any details about specific residues or distance between residues, ProteinContactGraphPlot offers more detailed information.
In the ProteinContactGraphPlot, the nodes (residues of the biomolecule) are ordered in a circular shape in a clockwise direction. Tooltips provide information about each residue, including chain name, amino or nucleic acid name, and residue number. Information about chains is provided with distinctly colored arrows, where the length of the chain is proportional to the length of the arrow. The directionality of the arrow follows the typical directionality in molecular biology ( See: https://en.wikipedia.org/wiki/Directionality_(molecular_biology) ).
In[]:=
ProteinContactGraphPlot["1I6U"]
Out[]=
The ProteinContactGraphPlot function includes options that allow users to define the cutoff distance between pairs of residues, set the size of a vertex based on its connectivity, and more (for a full list of options, see - https://resources.wolframcloud.com/PacletRepository/resources/WolframChemistry/ProteinVisualization/ref/ProteinContactGraphPlot.html ). These options can be used to identify important residues in the biomolecule.
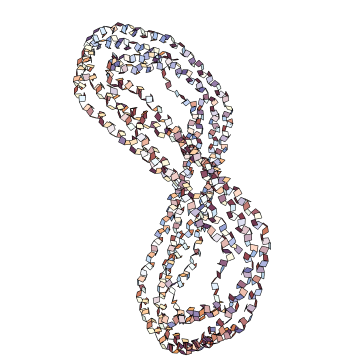
Here is the distance graph of crystal structure of the nucleosome core particle with scaled vertex size based on its connectivity:
In[]:=
ProteinContactGraphPlot["3LZ0","ScaledVertexSize"->True,VertexSize->15]
Out[]=
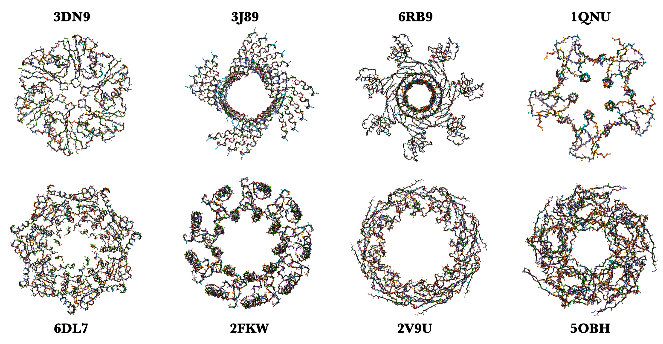
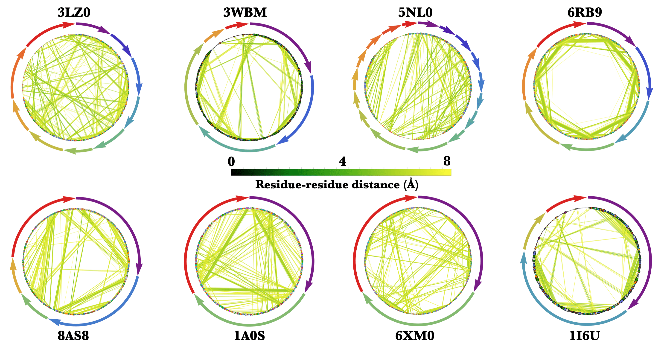
Here are some neat examples of contact graphs of proteins/protein-nucleic acid complexes with their four letter PDB IDs created using the ProteinContactGraphPlot function:
RamachandranPlot
RamachandranPlot
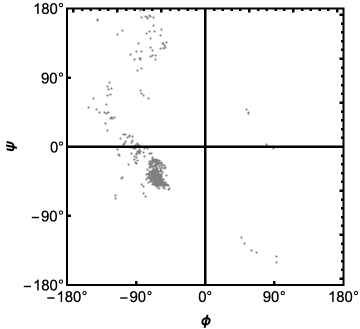
RamachandranPlot plots the dihedral angles ϕ and ψ of a protein or protein-nucleic acid complex (See : https://en.wikipedia.org/wiki/Ramachandran_plot ).
Here is the Ramachandran Plot of the deoxy human hemoglobin:
In[]:=
RamachandranPlot["1A3N"]
Out[]=
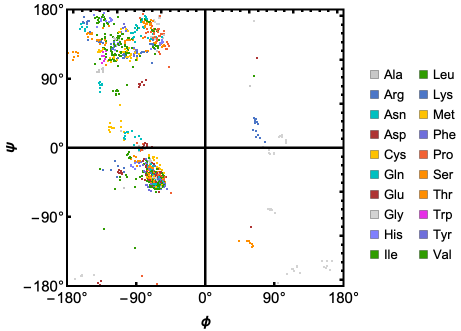
Options for the RamachandranPlot function allows users to define custom colors for individual residues, get dihedral angles for specific amino acids and more (For full list of Options see - https://resources.wolframcloud.com/PacletRepository/resources/WolframChemistry/ProteinVisualization/ref/RamachandranPlot.html ).
Here is the Ramachandran Plot of the human mitochondrial ClpP in complex with ONC201:
In[]:=
RamachandranPlot["6DL7","ResidueColors"->True]
Out[]=
Acknowledgements
Acknowledgements
I would like to thank Jason Biggs for guiding me in developing and improving this paclet and members of the Wolfram Alpha Chemistry Team for their useful feedback and suggestions.
CITE THIS NOTEBOOK
CITE THIS NOTEBOOK
Introducing the Wolfram ProteinVisualization paclet!
by Soutick Saha
Wolfram Community, STAFF PICKS, May 31 2023
https://community.wolfram.com/groups/-/m/t/2927764
by Soutick Saha
Wolfram Community, STAFF PICKS, May 31 2023
https://community.wolfram.com/groups/-/m/t/2927764