The objective is to analyse recently vaccination data made available @ https://github.com/owid/covid-19-data/tree/master/public/data/vaccinations .
The exercise is using SQL Functions described and defined in previous post (https://community.wolfram.com/groups/-/m/t/2195893)
In order to use Sql function I’ve created a Wolfram Package that can by found @ https://www.wolframcloud.com/env/damcalrom/Published/SQLOperators.wl
The exercise is using SQL Functions described and defined in previous post (https://community.wolfram.com/groups/-/m/t/2195893)
In order to use Sql function I’ve created a Wolfram Package that can by found @ https://www.wolframcloud.com/env/damcalrom/Published/SQLOperators.wl
Load SQL functions
Load SQL functions
In[]:=
CloudImport["https://www.wolframcloud.com/env/damcalrom/Published/SQLOperators.wl"];
Load vaccination data
Load vaccination data
Source: https://raw.githubusercontent.com/owid/covid-19-data/master/public/data/vaccinations/vaccinations.csv
The structure of file is described at https://github.com/owid/covid-19-data/tree/master/public/data/vaccinations
The structure of file is described at https://github.com/owid/covid-19-data/tree/master/public/data/vaccinations
filedata="https://raw.githubusercontent.com/owid/covid-19-data/master/public/data/vaccinations/vaccinations.csv";(*definetablecolumns*)cols={"location","isocode","date","totalvaccinations","peoplevaccinated","peoplefullyvaccinated","dailyvaccinationsraw","dailyvaccinations","totalvaccinationsperhundred","peoplevaccinatedperhundred","peoplefullyvaccinatedperhundred","dailyvaccinationspermillion"};(*importintosqltablestructure*)tbvacc=importSQL[filedata,",",cols];
Preview data
Preview data
tbvacc//(*filteronacountry*)whereSQL[#,isocode"FRA"]&//(*orderbymostrecentdate*)orderBySQL[#,{-AbsoluteTime[DateObject[date]]}]&//tableSQLAsDataset
Out[]=
Prepare data for the reporting
Prepare data for the reporting
- Aggregate data by country and transform measures into time series.
- Apply filter to exclude invalid values.
- Get the last percentage of vaccinated people
- Apply filter to exclude invalid values.
- Get the last percentage of vaccinated people
tbvaccagg= tbvacc//groupBySQL[#,{location}]&//summarySQL[#,Association["tsdaily"(TimeSeries[dailyvaccinations,{date}]//Normal//Cases[#,{t_,v_}/;NumberQ[v]]&//TimeSeries), "tsvaccperc"(TimeSeries[peoplevaccinatedperhundred,{date}]//Normal//Cases[#,{t_,v_}/;NumberQ[v]]&//TimeSeries)]]&// (*eliminateemptytimeseries*)whereSQL[#,Length[tsdaily["DatePath"]]>30&&Length[tsvaccperc["DatePath"]]>30]&;// AbsoluteTimingtbvaccagg//showTableSQL
Out[]=
{34.1966,Null}
Total Rows:137 Elapsed:0.
Out[]//TableForm=
Load cases/death Covid-19 data
Load cases/death Covid-19 data
Source: https://raw.githubusercontent.com/datasets/covid-19/main/data/countries-aggregated.csv
The measures (confirmed, recovered, deaths) are expressed in cumulative values
The measures (confirmed, recovered, deaths) are expressed in cumulative values
In[]:=
filecases="https://raw.githubusercontent.com/datasets/covid-19/main/data/countries-aggregated.csv";tbcases=importSQL[filecases,",",{"date","country","confirmed","recovered","deaths"}];
Preview data
Preview data
tbcases//(*filteronacountry*)whereSQL[#,country"France"]&//(*orderbymostrecentdate*)orderBySQL[#,{-AbsoluteTime[DateObject[date]]}]&//showTableSQL
Total Rows:546 Elapsed:0.541103
Out[]//TableForm=
date | country | confirmed | recovered | deaths |
2021-07-20 | France | 5952339 | 409403 | 111715 |
2021-07-19 | France | 5934122 | 408973 | 111682 |
2021-07-18 | France | 5929929 | 408739 | 111662 |
2021-07-17 | France | 5917397 | 408709 | 111657 |
2021-07-16 | France | 5906448 | 408567 | 111641 |
2021-07-15 | France | 5895453 | 408283 | 111619 |
2021-07-14 | France | 5884395 | 407965 | 111609 |
2021-07-13 | France | 5882945 | 407965 | 111597 |
2021-07-12 | France | 5875987 | 407685 | 111543 |
2021-07-11 | France | 5874719 | 407391 | 111515 |
Prepare data for analysis
Prepare data for analysis
- Aggregate data by country and transform measures into time series
- Exclude negative values and apply Differrences to have daily values instead of original cumulative values
- Exclude timeseries with less than 100 datapoints
- Apply a rolling 7 day average on measures.
- Exclude negative values and apply Differrences to have daily values instead of original cumulative values
- Exclude timeseries with less than 100 datapoints
- Apply a rolling 7 day average on measures.
tbcasesagg=tbcases// groupBySQL[#,{country}]&// summarySQL[#,Association["tsconfirmed"(TimeSeries[confirmed,{date}]//Differences//Normal//Cases[#,{t_,v_}/;v>0]&//TimeSeries), "tsdeaths"(TimeSeries[deaths,{date}]//Differences//Normal//Cases[#,{t_,v_}/;v>0]&//TimeSeries)]]&// whereSQL[#,Length[tsconfirmed["DatePath"]]>100&&Length[tsdeaths["DatePath"]]>100]&// rowMapSQL[#,{tsconfirmed,tsdeaths},MovingMap[Mean,#,Quantity[7,"Events"],Automatic]&]&;// AbsoluteTimingtbcasesagg//showTableSQL
Out[]=
$Aborted
Join the 2 tables on country
Now all timeseries of interest are in the same table
Now all timeseries of interest are in the same table
tbfinal=tbcasesagg// joinSQL[#,tbvaccagg,locationcountry]&;tbfinal//showTableSQL
Total Rows:93 Elapsed:1.×
-7
10
Out[]//TableForm=
Comparing countries data
Comparing countries data
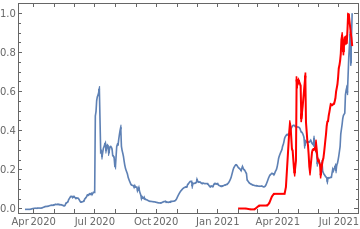
Plot all 3 timeseries on the same rescaled plot to have an idea of correlation.
Select a subset of countries for the analyse
Get the latest vaccination percentage for each country
Select a subset of countries for the analyse
Get the latest vaccination percentage for each country
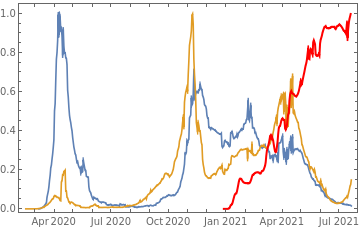
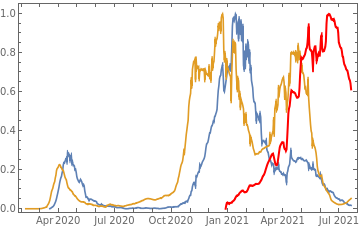
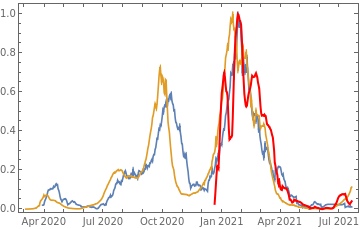
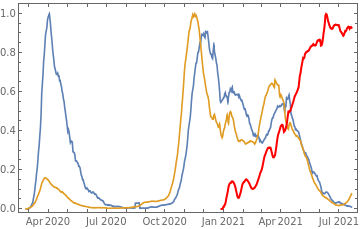
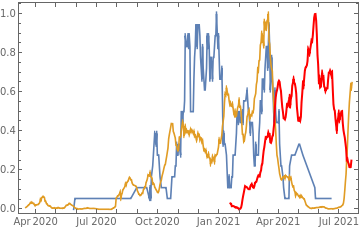
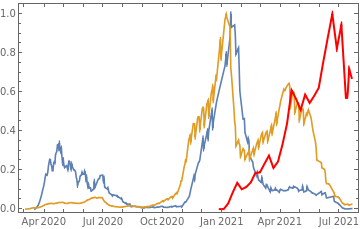
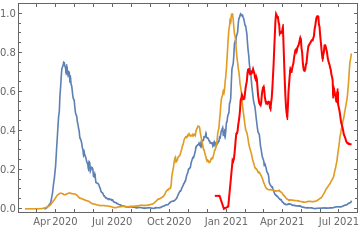
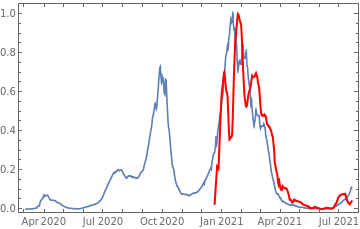
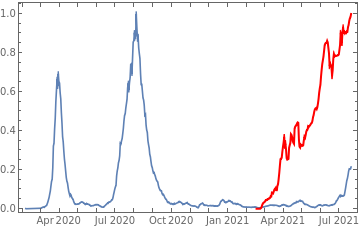
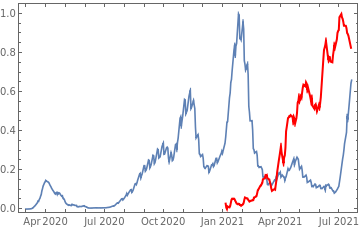
countries={"France","Sweden","Germany","United Kingdom","Malta","Israel","Italy"};tbfinal//whereSQL[#,ContainsAny[{country},countries]]&//addColumnsSQL[#,Association["plot"tsdeaths//Rescale, tsconfirmed//Rescale, tsdaily//Rescale// DateListPlot[#,PlotStyle{Automatic,Automatic,Directive[Red,Thick]}, PlotLegends{"deaths","cases","vaccine"}]&, "vaccinationpercent"tsvaccperc["LastValue"]]]&// selectSQL[#,{country,plot,vaccinationpercent}]&// showTableSQL
Total Rows:7 Elapsed:0.640882
Out[]//TableForm=
country | plot | vaccinationpercent | ||
France | 55.97 | |||
Germany | 59.77 | |||
Israel | 66.42 | |||
Italy | 60.81 | |||
Malta | 87.5 | |||
Sweden | 59.85 | |||
United Kingdom | 68.28 |
Define a new measure to calculate the growth rate of timeseries on last n datapoints
In[]:=
growrate[ts_,n_]:=ts//Normal//Take[#,-n][[{1,-1},2]]&//(Ratios[#]-1)*100&//Last//N;
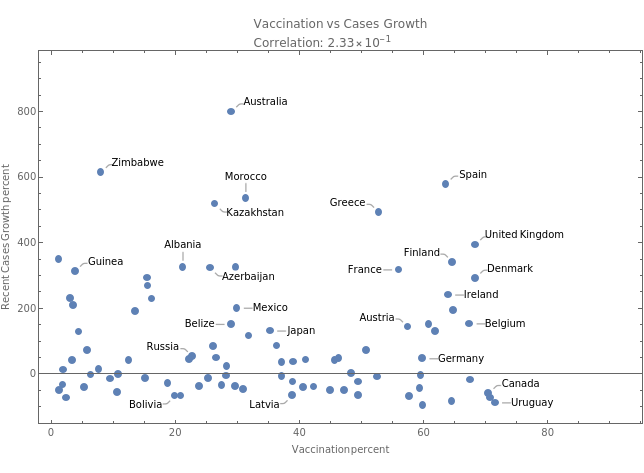
Calculate infections growth rate for last 30 days and compare for each country vaccination percent
tbfinal//addColumnsSQL[#,Association["casesgrowratepercent"growrate[tsconfirmed,30], "vaccinationpercent"tsvaccperc["LastValue"], "plot"tsconfirmed//Rescale, tsdaily//Rescale// DateListPlot[#,PlotStyle{Automatic,Directive[Red,Thick]}, PlotLegends{"cases","vaccine"}]&//Quiet ]]&//orderBySQL[#,{-casesgrowratepercent}]&//selectSQL[#,{country,vaccinationpercent,casesgrowratepercent,plot}]&//showTableSQL
Total Rows:93 Elapsed:6.01277
Out[]//TableForm=
country | vaccinationpercent | casesgrowratepercent | plot | ||
Malta | 87.5 | 8893.75 | |||
Israel | 66.42 | 2177.33 | |||
Senegal | 3.65 | 1520.77 | |||
Cyprus | 56.89 | 1425.27 | |||
Malawi | 2.01 | 1257.71 | |||
Australia | 28.98 | 800. | |||
Zimbabwe | 7.97 | 615.014 | |||
Spain | 63.52 | 579.754 | |||
Morocco | 31.31 | 535.5 | |||
Kazakhstan | 26.33 | 519.827 |
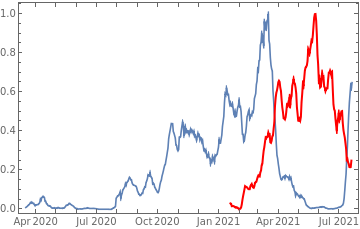
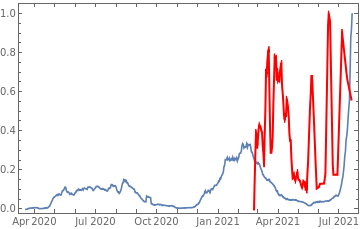
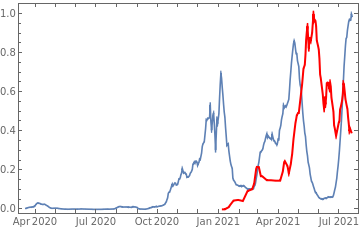
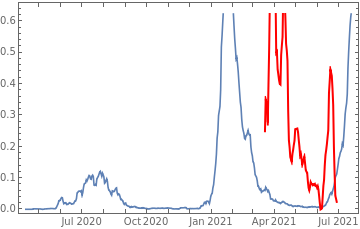
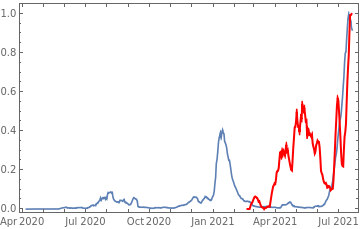
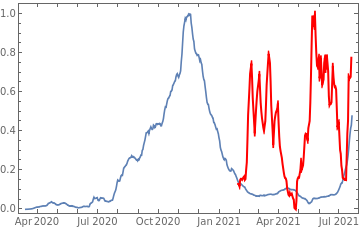
For Malte and Israel there is an significative infection growth while the vaccinations percentage are high but not for Senegal and Malawi.
There is no systematic relationship between higher vaccination percentage and new infections growth
Lets try to correlate the 2 measures
There is no systematic relationship between higher vaccination percentage and new infections growth
Lets try to correlate the 2 measures
tbfinal//addColumnsSQL[#,Association["casesgrowratepercent"growrate[tsconfirmed,30], "vaccinationpercent"tsvaccperc["LastValue"] ]]&//summarySQL[#,Association["plot"With[dataplot=MapThread[Callout,{Transpose[{vaccinationpercent,casesgrowratepercent}],country}], corr=Correlation[vaccinationpercent,casesgrowratepercent], dataplot// ListPlot[#, PlotLabelColumn[{"Vaccination vs Cases Growth",Row[{"Correlation: ",ScientificForm[corr,3]}]}], FrameLabel{"Vaccination percent","Recent Cases Growth percent"}, FrameTrue, ImageSizeMedium]&]]]&//showTableSQL
Total Rows:1 Elapsed:0.349141
Out[]//TableForm=
plot |
We do the same exercise for deaths growth rate vs vaccination rate
tbfinal//addColumnsSQL[#,Association["deathsgrowratepercent"(growrate[tsdeaths,30]//Quiet), "vaccinationpercent"tsvaccperc["LastValue"] ]]&//summarySQL[#,Association["plot"With[dataplot=MapThread[Callout,{Transpose[{vaccinationpercent,deathsgrowratepercent}],country}], corr=Correlation[vaccinationpercent,deathsgrowratepercent], dataplot// ListPlot[#, PlotLabelColumn[{"Vaccination vs Cases Growth",Row[{"Correlation: ",ScientificForm[corr,3]}]}], FrameLabel{"Vaccination percent","Recent Deaths Growth percent"}, FrameTrue, ImageSizeMedium]&]]]&//showTableSQL
Total Rows:1 Elapsed:0.299096
Out[]//TableForm=
plot |
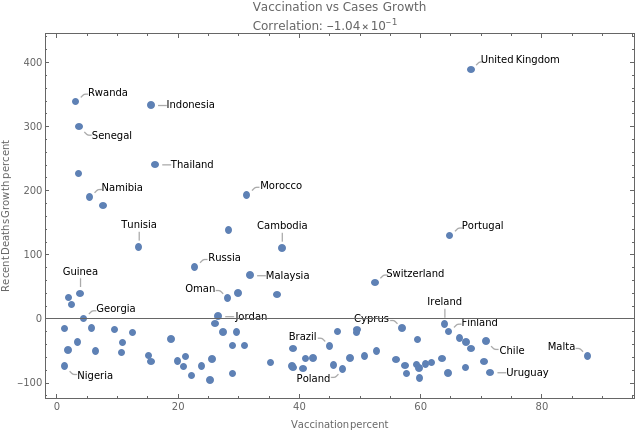
Voila .. Week correlation for given measures.
Any suggestions or different measures to evaluate the efficacy of vaccination campaigns are welcomed ...
Any suggestions or different measures to evaluate the efficacy of vaccination campaigns are welcomed ...