Visualizing the InSight Landing Site on Mars
Visualizing the InSight Landing Site on Mars
Author: Jeff Bryant
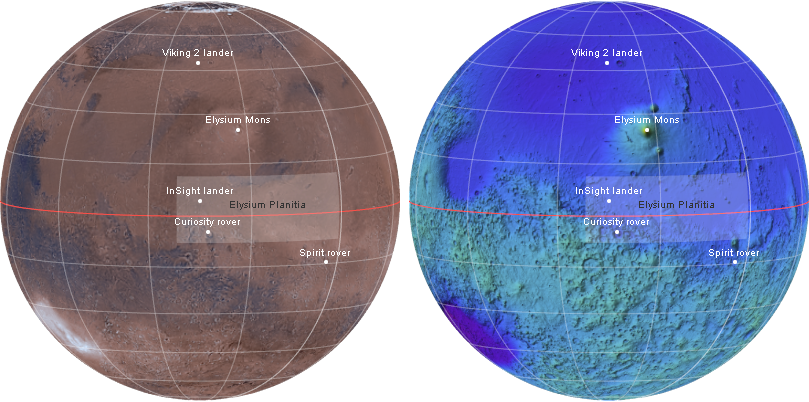
On Nov 26, 2018, NASA landed the InSight lander on the surface of Mars. The planned landing site was 4.5°N, 135°E, within Elysium Planitia. At the time of this post, the final landing coordinates have not been released, but is believed to be very close to the planned coordinates.
In[]:=
prims[ent_Entity,label_:Automatic]:=Module[{pos,nam},{pos,nam}=ent[{"Position","Name"}];{Disk[pos,.01],Text[If[label===Automatic,nam,label],pos,{0,-1.5}]}]prims[pos_GeoPosition,label_]:={Disk[pos,.01],Text[label,pos,{0,-1.5}]}
We can now construct a GeoGraphics expression that contains the data we want to visualize. The landing sites of a few additional probes and surface features have also been included for greater context.
In[]:=
marsmap[opts___]:=With[{pos1=GeoPosition[{4.5,135},Entity["Planet","Mars"]]},GeoGraphics[{Red,GeoPath["Equator"],White,prims[pos1,"InSight lander"],prims[Entity["DeepSpaceProbe","MarsScienceLaboratory"],"Curiosity rover"],prims[Entity["SolarSystemFeature","ElysiumMonsMars"]],prims[Entity["DeepSpaceProbe","VikingLander2"]],prims[Entity["DeepSpaceProbe","MERDashASpiritRover"],"Spirit rover"],{Black,Text["Elysium Planitia",Entity["SolarSystemFeature","ElysiumPlanitiaMars"]["Position"],{0,0}]},Opacity[.1],GeoBoundsRegion@(Entity["SolarSystemFeature","ElysiumPlanitiaMars"]["GeoBoundingBox"])},GeoGridLinesAutomatic,GeoGridLinesStyleOpacity[0.3,White],ImageSize400,GeoRangeAll,opts]]With[{pos1=GeoPosition[{4.5,135},Entity["Planet","Mars"]]},Grid[{{marsmap[GeoProjection{"Orthographic","Centering"pos1},GeoZoomLevel2],marsmap[GeoBackground"ReliefMap",GeoProjection{"Orthographic","Centering"pos1},GeoZoomLevel2]}}]]
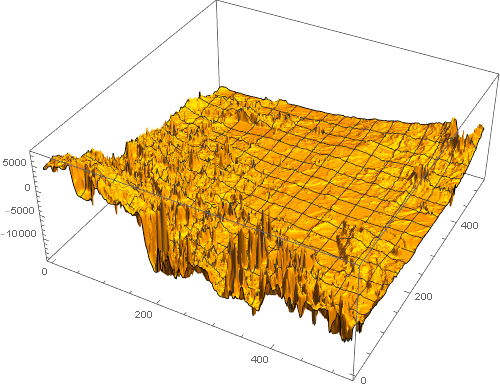
We can view the landing site in more detail by examining the elevation data for this part of Elysium Planitia. Here, we extract the data within a 300 mile radius of the landing site.
insight=GeoElevationData[GeoDisk[GeoPosition[{4.5,135},Entity["Planet","Mars"]],Quantity[300,"Miles"]],GeoZoomLevel5];
Without further specifications, the results make the landscape look quite rough.
ListPlot3D[Reverse[insight],PlotRangeAll,ImageSize500]
But the above is misleading. We can specify box ratios and other styles to more accurately represent the appearance of the landing site.
myBoxRatios[{min_,max_},radius_,verticalExaggerationFactor_:1]:={1,1,verticalExaggerationFactor(max-min)/(2radius)};style={MeshNone,PlotStyleRGBColor[156/255.,96/255.,62/255.],ImageSize500,BoxedFalse,AxesFalse,Lighting{{"Ambient",GrayLevel[.1]},{"Directional",GrayLevel[1],ImageScaled[{1,1,.1}]}},PlotRangeAll,Method{"ShrinkWrap"True}};ListPlot3D[Reverse[insight],BoxRatiosmyBoxRatios[MinMax[insight],Quantity[300,"Miles"],1],style]

Zooming in a bit further, we can only see a smattering of relatively small craters within a 100 mile radius of the landing site.
insight2=GeoElevationData[GeoDisk[GeoPosition[{4.5,135},Entity["Planet","Mars"]],Quantity[100,"Miles"]],GeoZoomLevel5];ListPlot3D[Reverse[insight2],BoxRatiosmyBoxRatios[MinMax[insight2],Quantity[100,"Miles"],1],style]

The landing site is relatively flat which is optimal for the mission since it needs smooth, loose terrain that is easy to burrow the seismometer and instrumentation into.