Last modified on: Thursday, July 12, 2018 at 22:57
Author Info
Name:
Alex Chandler
Mentor:
Douglas Smith
End of Camp Presentation Content
Title of project:
Using Multilevel Graph Partitioning Algorithms to Construct Compact and Contiguous Districts
Goal of the project:
By incorporating FIPS codes and data for each tract, I will use graph theory by exploring the capabilities of the FindGraphPartition function, dividing various states into compact and contiguous districts. I will then incorporate geometric data to combine the shape of each tract with the tract’s respective location. I then compare my synthetic districts to real congressional districts.
Add the most representative image of your project here. (We recommend just 1 image, if you add more, we will make a collage of the images.)
Image:
Summary of Results:
By incorporating graph theory and data for each tract, I have created a new way of creating and analyzing districts. My partitioning algorithms can create realistic, compact, and continuous districts by taking into account the population of each tract and if the tract is on the border of a county.
Future work:
By comparing synthetic districts to real districts in all states, my code could be used to further analyze districts for gerrymandering, both partisan and racial.
Detailed Project Notes
Using Multilevel Graph Partitioning Algorithms to Construct Compact and Contiguous Districts
Using Multilevel Graph Partitioning Algorithms to Construct Compact and Contiguous Districts
Alex L. Chandler
In[]:=
Gerrymandering is a practice that has been under intense scrutiny, especially as of recent with the Supreme Court being forced to make decisions on a not well understood topic. In my essay, I will offer an alternative to the redistricting process. By incorporating FIPS codes and data for each tract, I will use graph theory by exploring the capabilities of the FindGraphPartition function, dividing various states into compact and contiguous districts. I will then incorporate geometric data to combine the shape of each tract with the tract’s respective location. I then compare my synthetic districts to real congressional districts.
What are Districts and what are they made out of?
What are Districts and what are they made out of?
A congressional district is an electoral constituency based off population. The winner of each congressional district gets one elector vote, and the winner of the state gets two votes. There are a total of 538 electoral votes, 435 coming from congressional districts, three from the District of Columbia, and 100 coming from the winners of each state.
What is a FIPS Code
What is a FIPS Code
A FIPS code is used to identify US State, County, and Tract.
12 345 678901
12 345 678901
The First two numbers are the state number; the following two are county, and the last six are the tract number.
Data Source Links
Data Source Links
https : // s4.ad.brown.edu/Projects/Diversity/Researcher/Pooling.htm (* source of the adjacency files *)
https://guides.lib.uci.edu/c.php?g=334480&p=2249985 (how census subdivisions work)
https://github.com/gerrymandr/state-adjacency-graphs (if desperate might be useful to generate adjacencies)
https : // cran.r - project.org/web/packages/spdep/vignettes/nb.pdf (neighborhood creation in R, discussing subtleties)
https://www.census.gov/geo/maps-data/data/gazetteer2010.html(contains information on tract population, area, etc.)
glaros.dtc.umn.edu/gkhome/fetch/sw/metis/manual.pdf (contains METIS software and description of multilevel graph algorithm)
Import
Import
Graphs
Graphs
Tract Data
Tract Data
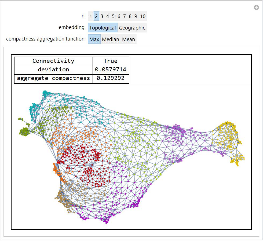
Geographic Associations and Creation of Alternative Graph Embeddings
Geographic Associations and Creation of Alternative Graph Embeddings
Discussion and Vocabulary
Discussion and Vocabulary
Partitioning Functions
Partitioning Functions
Metric Functions
Metric Functions
Testing
Testing
Visualization of Districting
Visualization of Districting
Import and Association Creation For Tract Polygon Data
Import and Association Creation For Tract Polygon Data
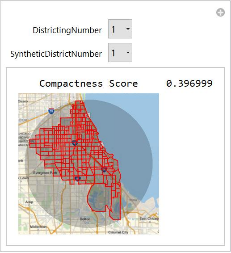
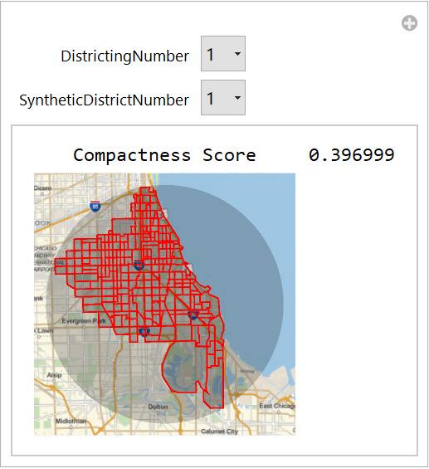
Compactness Synthetic Districts
Compactness Synthetic Districts
Compactness Measurement For Real Districts
Compactness Measurement For Real Districts
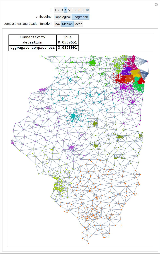
Visualizing Synthetic Districts
Visualizing Synthetic Districts
Compactness Analysis and Visualizing
Compactness Analysis and Visualizing
Importing Demographic Data
Importing Demographic Data
Visualization for Analysis of Racial Distribution
Visualization for Analysis of Racial Distribution
Distribution for Real and Synthetic Texas Districts for African Americans
Distribution for Real and Synthetic Texas Districts for African Americans
In[]:=
Histogram[{Flatten[blackpopsforsyntheticdistricts/totalpopforsyntheticdistricting//N],TexasDistrictBlackProportion},Automatic,"Probability",ChartLegends{"Synthetic","Real"},ChartLayout"Stacked"]
Probability Plot for African Americans in Texas
Probability Plot for African Americans in Texas
A Probability Plot Compares the CDF of against the CDF of a normal distribution.
list
In[]:=
ProbabilityPlot[{Flatten[blackpopsforsyntheticdistricts/totalpopforsyntheticdistricting//N],TexasDistrictBlackProportion},PlotLegends{"Synthetic","Real"}]
Distribution for Real and Synthetic DIstricts for White People in Texas
Distribution for Real and Synthetic DIstricts for White People in Texas
In[]:=
Histogram[{Flatten[whitepopsforsyntheticdistricts/totalpopforsyntheticdistricting//N],TexasDistrictWhiteProportion},Automatic,"Probability",ChartLegends{"Synthetic","Real"},ChartLayout"Stacked"]
I do the same analysis for Massachusetts. Do the same deviations in patterns apply to a state with a lower African American population percentage?
Distribution for Real and Synthetic Districts for African Americans
Distribution for Real and Synthetic Districts for African Americans
For this histogram, I ran FindGraphPartition successfully 2000 times, creating 1800 different districts.
Probability Plot for African Americans
Probability Plot for African Americans
Distribution for Real and Synthetic DIstricts for White People
Distribution for Real and Synthetic DIstricts for White People
Conclusions in Detail
Conclusions in Detail
By incorporating graph theory and data for each tract, I have created a new way of creating and analyzing districts. By taking into account the population of each tract and if the tract is on the border of a county, my partitioning algorithms can create realistic, compact, and continuous districts. in my partitioning algorithm, I base the vertex only off the tract’s population, however one could assign vertex weights in a fashion to ensure districts of equal levels of race, wealth, or political voting history. Furthermore, by comparing synthetic districts to real districts in all states, my code could be used further to analyze districts for gerrymandering, both partisan and racial.
XXX
Data Sources Links/References
Data Sources Links/References
Data Source Links
https : // s4.ad.brown.edu/Projects/Diversity/Researcher/Pooling.htm (* source of the adjacency files *)
https://guides.lib.uci.edu/c.php?g=334480&p=2249985 (how census subdivisions work)
https://github.com/gerrymandr/state-adjacency-graphs (if desperate might be useful to generate adjacencies)
https : // cran.r - project.org/web/packages/spdep/vignettes/nb.pdf (neighborhood creation in R, discussing subtleties)
https://www.census.gov/geo/maps-data/data/gazetteer2010.html(contains information on tract population, area, etc.)
glaros.dtc.umn.edu/gkhome/fetch/sw/metis/manual.pdf (contains METIS software and description of multilevel graph algorithm)