Tone Mapping and Gaussian Blur for Enhanced Visualization
Tone Mapping and Gaussian Blur for Enhanced Visualization


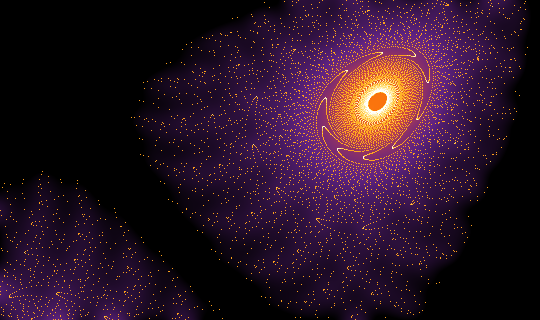
This Demonstration illustrates the use of tone mapping, Gaussian blur, and colorizing to achieve visually enhanced 2D rendering of certain datasets. A variation of the Hénon map is used as an example.