The Precision-Recall Curve in Information Retrieval Evaluation
The Precision-Recall Curve in Information Retrieval Evaluation


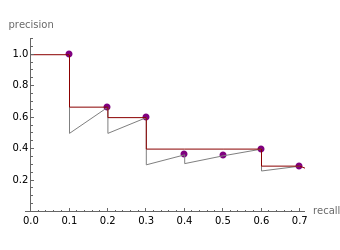
Precision and recall are the basic measures for the evaluation of information retrieval performance. Their values can be plotted in a so-called precision-recall curve.
The graph is plotted by connecting the points given by the (precision, recall) values corresponding to retrieved items. At each recall level, precision decreases until the next relevant item is found.
The graph can be smoothed out by using interpolated precision. Interpolated precision for a given recall level is defined as
• 1 if recall is 0
• the maximum precision over all previous recall levels if recall is greater than 0
Mark a retrieved item as relevant or irrelevant by clicking it and watch how the precision-recall curve changes. Relevant items are denoted by a purple background when clicked. Mouseover text fields to see definitions. Mouseover dots in the plot area to see their values.