The Empirical Rule for Normal Distributions
The Empirical Rule for Normal Distributions

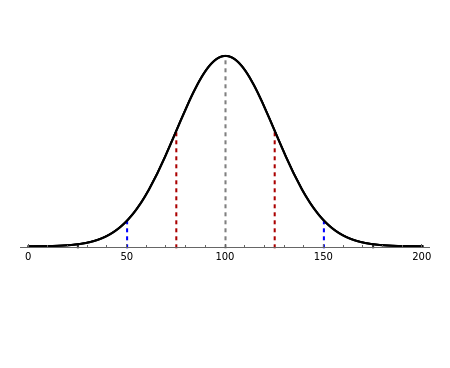
This Demonstration illustrates the "empirical rule" for normal distributions: approximately 68% of the area under the curve falls within one standard deviation of the mean, approximately 95% within two standard deviations, and approximately 99.7% within three standard deviations. Various display options are available (see the Snapshots and the Details section).