The Effects of Coinsurance and Deductibles on Optimal Precautions for Weibull-Distributed Loss
The Effects of Coinsurance and Deductibles on Optimal Precautions for Weibull-Distributed Loss


This Demonstration examines the effects of coinsurance and deductibles on optimal precautions for Weibull-distributed losses, such as those frequently used to model hurricanes, earthquakes, and other catastrophes. The issue is important because regulation of deductibles and coinsurance mediates two dueling goals. One goal is to provide insureds and those who depend on them with fairly complete insurance. A second goal, however, is to protect the public, who often backstop catastrophe insurance schemes, from precaution-decreasing moral hazard likely to result when insurance is very complete. Thus, in assessing the virtue of regulations requiring heightened deductibles and coinsurance, it is important to consider the magnitude of loss reductions likely to result: the greater the effect, the stronger the case for regulation. This Demonstration estimates such magnitudes based on a theoretical model of insured behavior.
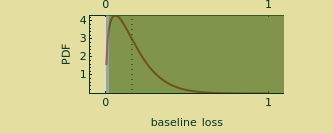
To interact with this Demonstration, you select a level of risk aversion. Higher levels of risk aversion result in worse outcomes being weighted progressively more heavily than better ones. You select the price of taking one unit of precautions in a system calibrated such that each marginal unit of precaution reduces the expected loss from accidents by half. You select the probability that a catastrophic event such as a windstorm or an earthquake occurs at all; during many policy periods it is quite likely that no catastrophic event will occur. You then select two parameters to the Weibull distribution of baseline losses if an event occurs. Baseline losses are calibrated such that a materialization of 1 means that the loss is equal to the value of the property insured. The top graphic of the Demonstration then produces the PDF of the resulting Weibull distribution. The blue zone (often very thin) represents losses less than the deductible; the green zone represents losses in excess of the deductible. A dotted line shows the mean value of the Weibull distribution. Finally, you select the deductible and coinsurance levels of the policy. The deductible is measured as a percentage of the value of the property insured. Coinsurance is measured as a percentage of loss in excess of the deductible.
ρ
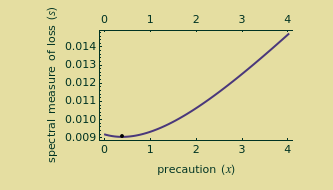
The Demonstration responds to these control selections with two other panels of information. A bottom graphic shows the "spectral measure" (a kind of weighted average) of the insured's net losses as a function of the level of precautions taken by the insured. A rational insured should be expected to select the level of precautions that minimizes this spectral measure. A black point on the lower graphic shows this optimal precaution level. A grid on the right shows a number of statistics created by the controls and various computations. Statistics in the top gold zone largely recapitulate the controls selected by the user. Statistics in the blue zone show optimal precautions, losses as a fraction of what would occur if no precautions were taken, and the spectral measure of losses for the optimal level of precautions. Statistics in the red zone show the effect of changing insurance policy parameters. Each "loss " represents the reduction in loss that would be caused by the change described for the row. Thus a row that reads "loss from 20% higher coinsurance 0.393" means that increasing the coinsurance level by 20 percentage points would change optimal precautions such that losses would be reduced by 39.3% from the level induced by optimal precautions with the current insurance policy parameters. The higher these "loss s," the more effective policy changes would be in reducing the losses caused by catastrophes.
Δ
Δ
Δ
The Demonstration shows that the effect of coinsurance changes depends critically on such factors as the cost of the precautions. When the cost of precautions is high, changes in coinsurance rates from low levels may have little or no effect on the optimal level of precautions. Other regulations, such as mandatory conditioning of indemnity obligations on maintenance of certain precautions, may be necessary to reduce the risk of loss. When the cost of precautions is low, however, changes in coinsurance rates and deductibles may have dramatic effects. Reductions of 50% or more from increases in coinsurance rates by 20 percentage points are not uncommon, nor are reductions of 10% or more from increases in deductibles by 2 percentage points (such as going from 2% of the property value to 4% of the property value).