The 2001 CSO Mortality Tables
The 2001 CSO Mortality Tables


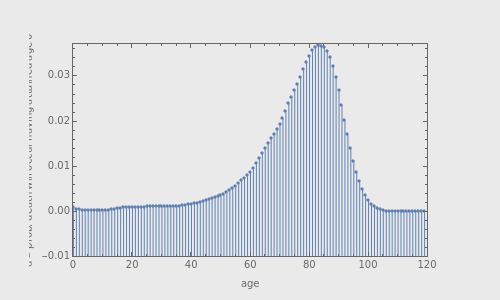
The 2001 CSO Mortality Tables represent the most widely used approximations as to the expected rates of death in the United States as a function of age. This Demonstration manipulates that data to produce three types of plots. The first type shows , the probability that someone alive at the axis age will die the following year. The second type shows , the probability that someone alive at a user-specified "attained age" will be alive at the axis age. The third type shows , the probability that someone alive at a user-specified attained age will die during the axis age.
q
x
t
ℓ
t
x
d
x