Tax Rates and Tax Revenue
Tax Rates and Tax Revenue

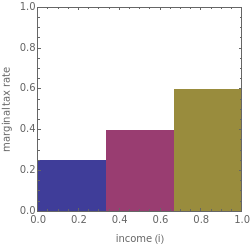
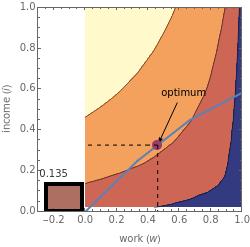

A significant debate in tax policy is the extent to which increasing marginal rates of taxation will increase tax revenues. This Demonstration lets you explore this issue by letting you set marginal rates for different levels of income and parameters of the taxpayers' utility as a function of the amount they work and the amount of net income they receive. The graphic on the top left lets you set tax rates for three different income brackets. The graphic on the top right shows the utility of the taxpayer for different levels of work and income, the feasible trade-offs between the two given the tax structure. The copper rectangle at the left of the top right graphic shows the amount of tax revenue the government receives. The top panel shows the utility function to be optimized. This model examines the effects of changing tax rates on a single hypothetical taxpayer. With multiple taxpayers involved, as would be the case in the real world, the effect of changing tax rates is considerably more complex.