Study of the Dynamic Behavior of the Lorenz System
Study of the Dynamic Behavior of the Lorenz System


This Demonstration presents the dynamic behavior of the Lorenz system:
dx
dt
dy
dt
dz
dt
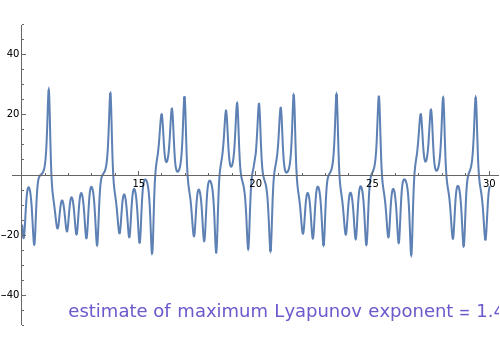
For a particular selection of model parameters , , and , you can observe periodic behavior, period doubling, or chaotic behavior. The Demonstration illustrates several important concepts of nonlinear dynamics, such as the time-series plot, the phase-space diagram, the power spectrum, and the autocorrelation function plot. In addition, an estimate of the maximum Lyapunov exponent is displayed for selected model parameters.
σ
r
b
For , , and , you can observe chaotic behavior, which is confirmed by the power spectrum diagram. The phase-space diagram is that of a strange attractor. In addition, the estimate of the maximum Lyapunov exponent is close to 1.49. A positive Lyapunov exponent is further indication of chaotic behavior.
σ=16
r=45.92
b=4
For , , and , you can observe periodic behavior, which is confirmed by the power spectrum diagram. The phase-space diagram is that of a limit cycle. In addition, the estimate of the maximum Lyapunov exponent is approximately equal to zero. Thus, all Lyapunov exponents are less than zero, which is a further indication of periodic behavior.
σ=19.8
r=56
b=1