Student's t-Distribution
Student's t-Distribution


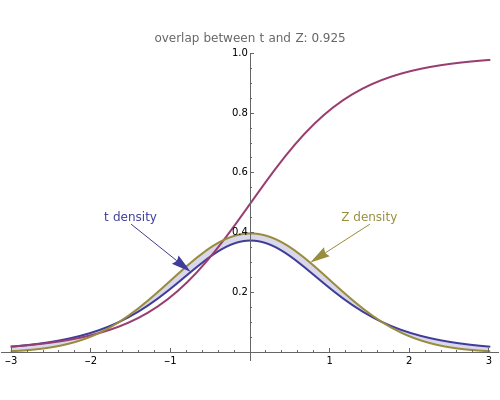
If is a standard normal random variable, is a chi-squared random variable with degrees of freedom, and and are independent, then follows a -distribution with degrees of freedom. Subtracting from the mean of a random sample of size from a normal population the population mean and dividing by the sample standard deviation yields a variable that follows a -distribution with degrees of freedom. Because of this, percentiles of the -distribution are useful in estimating the parameters of an unknown normal population. The mean of the -distribution is zero, and the variance is twice the number of degrees of freedom. Student -distributions are very close to the standard normal distribution, and become closer as the number of degrees of freedom increases. The overlap computed is the area of the region under both curves; note that the area under each curve is 1.
Z
Y
ν
Z
Y
Z
Y/ν
t
ν
n
t
n-1
t
t
t