Standard American and European Options
Standard American and European Options


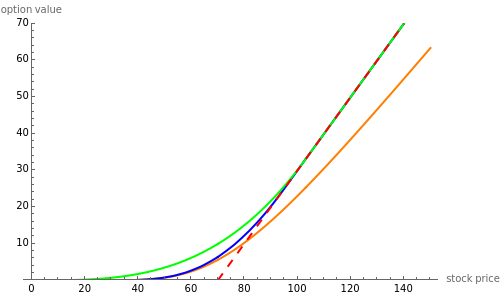
This Demonstration explores graphically the relationship between standard American and European options on securities. The graph shows one straight line and three curves. The dashed red straight line (together with a part of the axis) represents the payoff function of a European option (call or put, depending on the user's choice). The orange curve represents the values of a standard European option, the blue curve a standard American option, and the green curve the perpetual (time-independent) option. You can hover over a curve to see what it represents.
x