Spread of Zika in Brazil Using the Ross-MacDonald Model
Spread of Zika in Brazil Using the Ross-MacDonald Model
The spread of the Zika virus throughout a population can be modeled using equations that depend on the time elapsed after the initial outbreak and the average temperature in the region.
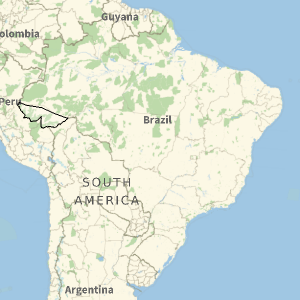
In this Demonstration, you can select states of Brazil with preset temperatures for each. You will see the rate of spread as a red dot on the graph and a map of the state that turns more red in proportion to the spread of the virus.
The Demonstration illustrates the rate at which populations can be infected by Zika, in the absence of preventive measures such as treatment or quarantine.

