Sports Seasons Based on Score Distributions
Sports Seasons Based on Score Distributions


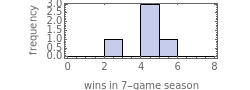

How does your sports team's success over a season vary according to the statistical distribution of its scores and those of its opponents? This Demonstration from the field of sabremetrics lets you select two parameters for your team and for its adversary that describe the statistical distribution of scores. It then determines for a user-selected number of sample seasons the number of wins and (where permitted) the number of ties of your team over all of those seasons. It produces histograms showing the distribution of scores for your team and its opponent. It also produces histograms of the number of wins and ties over each of the sample seasons. You can select the type of two-parameter distribution from which scores will be drawn, the number of games in a season, and whether games are permitted to end in a tie. It is worth noting that the distribution of wins is likely to have a standard deviation that will prove significant in a competitive league, that is, there may be a fair amount of "luck" in determining your team's standings.