Sports Scores
Sports Scores


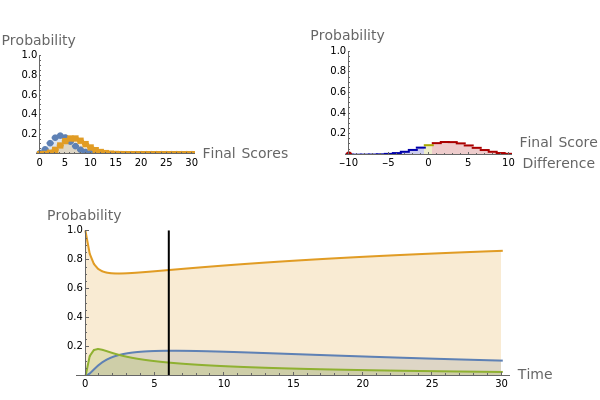
Down one point. Six minutes left. Opposing a superior team. Can your hometown heroes come back to win the championship before the clock runs out? This Demonstration answers that question along with countless others, calculating probability distributions for final scores, final score differences, and win-loss-draw odds. The model makes only one assumption: namely, that scoring occurs randomly at the specified rate. This assumption is most valid for sports like baseball or soccer and least valid for sports like American football or basketball.