Spectral Distribution of Total Energy Emitted by a Black Body versus Temperature
Spectral Distribution of Total Energy Emitted by a Black Body versus Temperature
1
0.
ComplexInfinity
1
5
0.
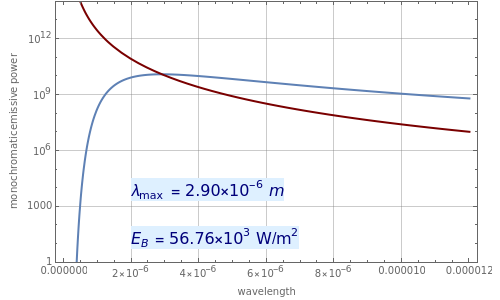
This Demonstration plots the monochromatic emissive power of a black body in at user-set values of the temperature (blue curve). The locus of the maximum values of the monochromatic emissive power (red curve) is given by Wien's displacement law:
W/
3
m
λ
max
-3
10
The Demonstration also displays the value of as well as the total emissive power, (expressed in ), which is given by the Stefan–Boltzmann law:
λ
max
E
B
W/
2
m
E
B
4
T
σ=5.676×W/
-8
10
2
m
4
K

