Smith's Second-Order Method in Process Dynamics
Smith's Second-Order Method in Process Dynamics


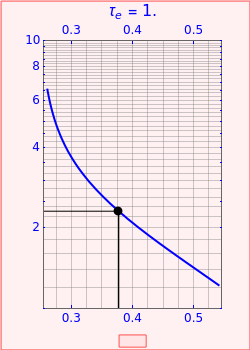
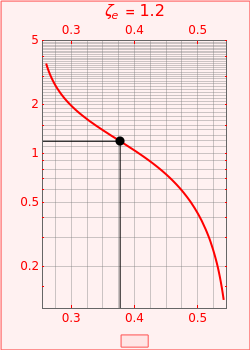
Consider an overdamped model with a step response represented by , where and are the time constant and the damping coefficient, respectively. It is possible to use the step-response data in order to obtain approximate values for and . Such a method was developed by Smith [1, 2] and uses the times at which the normalized response reaches 20% and 60% (at times and . Indeed, the ratio / gives (red curve) and /τ (blue curve). It is found that the approximate values of the time constant and the damping coefficient ( and ) match the exact values, which are selected by the user, perfectly. A separate plot (select "output") shows the exact response of the second-order process to a unit step, as well as the values of and , identified by the blue and red dots.
G=1+2τζs+1
2
τ
2
s
τ
ζ>1
τ
ζ
t
20
t
60
)
t
20
t
60
ζ
t
60
τ
est
ζ
est
t
20
t
60