Residue Curve Maps in a Triangular Ternary Diagram
Residue Curve Maps in a Triangular Ternary Diagram


Consider a ternary ideal mixture of components , , and . The relative volatilities of the components and with respect to component are labeled and .
A
B
C
A
B
C
α
13
α
23
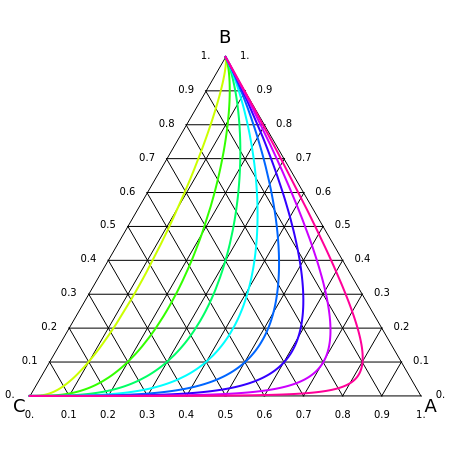
This Demonstration depicts the residue curve map in an equilateral-triangular ternary diagram for user-set values of the relative volatilities. The saddle point is the intermediate boiling point (component in the first snapshot). The stable node is component (see the first snapshot), because it is the heaviest component. The unstable node is the lightest component (component in the first snapshot).
A
C
B