Residue Curve and Bubble Temperature Distribution for a Ternary Mixture
Residue Curve and Bubble Temperature Distribution for a Ternary Mixture

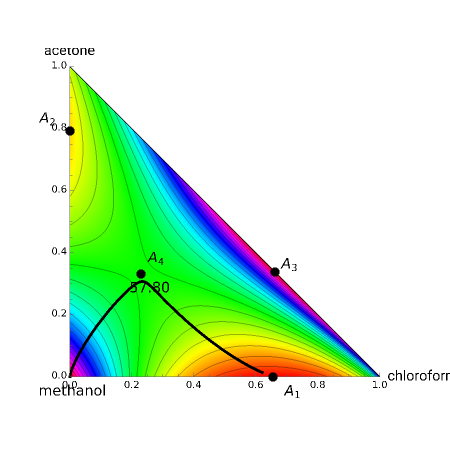
Consider a ternary mixture composed of chloroform, acetone, and methanol. This mixture deviates from ideal behavior. Thus, the Wilson model for activity coefficients and the modified Raoult's law are used to predict vapor-liquid equilibrium data.
This Demonstration plots the residue curve passing through the locator's position. Bubble-temperature distribution is superimposed on this plot, which helps identify the nature of the extreme points. The low-temperature regions appear in yellow and orange; the high-temperature locations are shown in magenta and blue. Finally, the green areas indicate temperatures with intermediate values. It is clear that the ternary azeotrope (labeled by in the plot), as well as pure acetone and pure chloroform, are all saddle points. There are two unstable nodes (labeled and in the triangular diagram), with low-boiling temperatures: (1) the azeotrope between methanol and chloroform and (2) the azeotrope between methanol and acetone. There are two stable nodes, with high boiling temperatures: (1) the azeotrope between acetone and chloroform (labeled in the figure) and (2) pure methanol. Bubble temperature at the locator's position, expressed in °C, is also displayed. Finally, iso-temperature curves are plotted too.
A
4
A
1
A
2
A
3
Azeotrope locations and boiling temperatures are:
mole% | BP°C | |||
chloroform | methanol | acetone | ||
A 1 | 65.52 | 34.48 | 53.82 | |
A 2 | 20.93 | 79.07 | 55.35 | |
A 3 | 66.13 | 33.21 | 64.45 | |
A 4 | 22.90 | 43.89 | 33.21 | 57.32 |