Residual-Fit Spread Plot
Residual-Fit Spread Plot


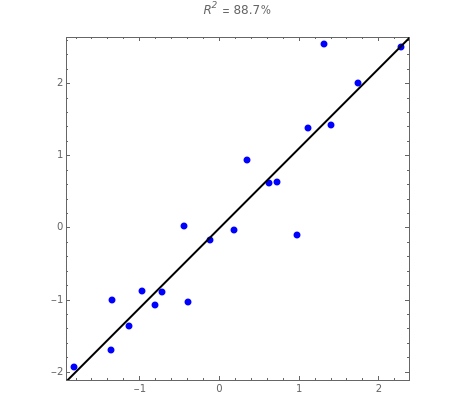
The residual-fit spread (RFS) plot is illustrated using simple linear regression. In general, the purpose of the RFS plot is to provide a visualization of how well a statistical model fits the data. It provides a graphical alternative to the coefficient of determination.
In this Demonstration, a random sample of size is generated from a bivariate normal distribution with mean zero, unit variances, and correlation parameter . In the first graph, "data with LS line", the data and least-squares regression line are shown, as well as the estimated , the coefficient of determination. is the fraction of variability accounted for by the fitted model. Next, the RFS plot is shown. This plot is a trellis-style graphic with a quantile plot of the fitted values minus the mean in the left panel and a quantile plot of the residuals on the right. Grid lines that divide the plotting area into equally sized rectangles are shown to enhance the visual comparison of the panels.
n
ρ
2
R
2
R
The impact of randomness can be explored by changing the random seed.