Reliability Distributions
Reliability Distributions


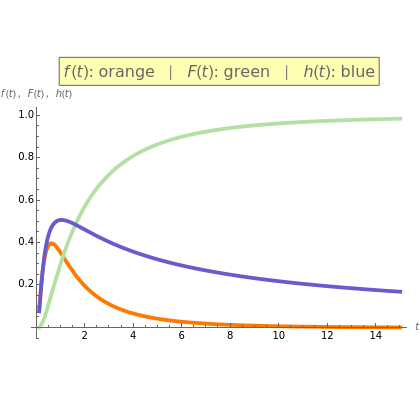
Failures over time for certain electronics products have been modeled by probability distribution functions, , of at least three types: lognormal, exponential and Weibull. This Demonstration shows how the probability distribution functions appear with varying values of the parameters ( and for the lognormal, for the exponential, and α and β for the Weibull distributions). The shapes of the cumulative failure distribution functions, , for these failure distributions are also shown. Also shown are curves for the hazard rate, or the instantaneous failure rate, = , which is the ratio of the failure distribution to the so-called survival distribution, . Note that for proper selection of the parameters, the exponential distribution is a special case of the Weibull distribution.
f(t)
μ
σ
λ
F(t)
h(t)
f(t)
1-F(t)
1-F(t)