Rate of Change of the Distance between Two Point Masses
Rate of Change of the Distance between Two Point Masses


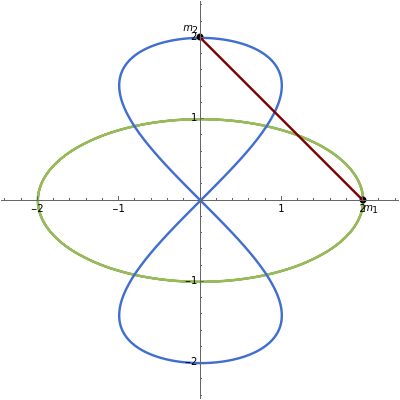
The green curve is the parametric plot of the path (t)=(cos(t),sin(t)) and the blue curve is the parametric plot of the path (t)=(sin(t),cos(t)). The point masses and move along the green and blue curves, respectively, as the time varies. As we can see, both paths are sinusoidal functions with chosen amplitudes , and frequencies , . The Demonstration keeps track of the distance between the two point masses, and the rate of change of this distance with respect to time , that is, the time derivative of the distance.
r
1
a
1
b
1
c
1
d
1
r
2
a
2
b
2
c
2
d
2
m
1
m
2
t∈[0,2π]
a
j
c
j
b
j
d
j
j=1,2
t