Probability Distribution for the kth Greatest of a Sequence of n Random Numbers
Probability Distribution for the kth Greatest of a Sequence of n Random Numbers


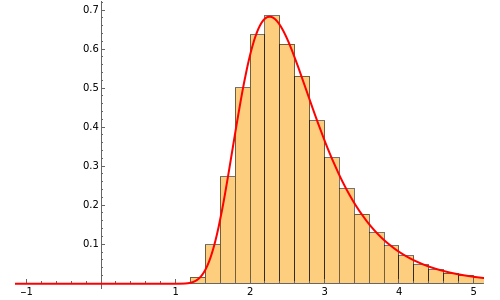
This Demonstration shows a simple example of using extreme value theory to calculate the probability density function for the greatest number in a series of random numbers drawn from three distributions of some importance in financial calculations. Many observations of the greatest number in a sample of size drawn randomly from the specified distribution are taken and displayed via a histogram. The red curve is the graph of the analytical expression for the smallest number, derived by considering the probability that, in a sequence of random numbers, numbers are greater than and numbers are smaller, all this weighted by the binomial distribution (see Details).
th
k
n
st
(k+1)
n=20
th
k
n
k
x
n-k