Probabilistic Model Showing Sigmoid Semilogarithmic Survival
Probabilistic Model Showing Sigmoid Semilogarithmic Survival


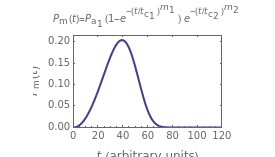

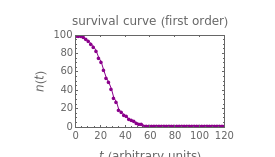

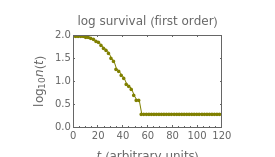
Most isothermal microbial survival curves plotted on semilogarithmic coordinates appear linear, concave upward, or concave downward. This indicates that the underlying mortality probability rate is constant, monotonically falling, or monotonically rising, respectively. Other mortality patterns emerge when the mortality probability rate function has a peak or valley, in which case the resulting sigmoid curve starts with downward concavity and ends with upward concavity, or vice versa. This Demonstration simulates such survival patterns, as well as monotonic but with two inflection points, using a fully probabilistic model where the underlying mortality probability rate function is constructed from combinations of two stretched exponential (Weibullian) terms.