Pressure Profile for Column of Multiple Fluids
Pressure Profile for Column of Multiple Fluids


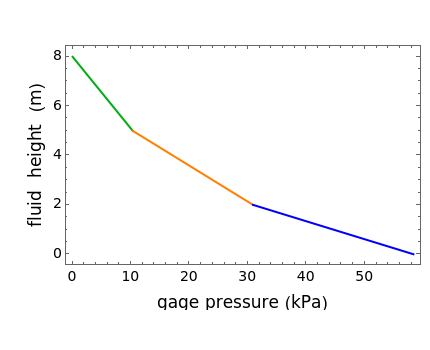
This Demonstration shows the effects of fluid height and density on hydrostatic pressure. You can vary both the absolute fluid height and density of the bottom fluid (blue). The middle fluid (orange) and top fluid (green) variables are adjusted with respect to the bottom fluid. This results in a total hydrostatic pressure profile that indicates the gage pressure at different heights in the container.