Ponchon-Savarit Diagram for Methanol-Water Mixture
Ponchon-Savarit Diagram for Methanol-Water Mixture


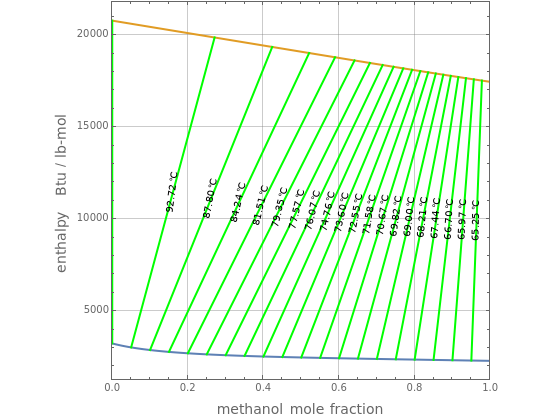
This Demonstration shows plots of the Ponchon–Savarit diagram (i.e., (y) and (x)) for a methanol-water mixture at user-set values of the total pressure, . In addition, the tie lines or isotherms are shown in green. The data obtained in our simulation, for , agrees very well with those given in Henley and Seader's classic textbook [1], which are shown by red dots. The vapor-liquid equilibrium data is also plotted in a separate diagram.
H
V
h
l
P
P=760mmHg