Ponchon-Savarit Diagram for an Ethanol-Water Binary Mixture
Ponchon-Savarit Diagram for an Ethanol-Water Binary Mixture


The Ponchon–Savarit diagram provides a graphical method for solving coupled material and energy balances in separation processes involving binary mixtures. This Demonstration illustrates how the Ponchon–Savarit diagram can be computed for a nonideal binary mixture that has an azeotrope.
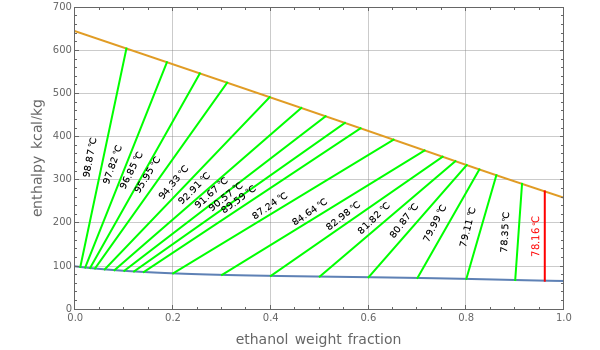
Consider a binary mixture of ethanol and water at a low to moderate pressure, , to be selected by the user. The gas phase is assumed ideal, but the liquid phase is nonideal. The Demonstration plots the Ponchon–Savarit diagram, which is also called the enthalpy-composition diagram. Enthalpy is expressed in kcal/kg and composition is expressed in weight fraction of ethanol. Also shown is the vapor equilibrium curve for ethanol-water.
P
Enthalpies for the liquid and vapor phases are computed using the following equations:
H
L
x
ethanol
x
ethanol
C
P,L,ethanol
T
ref
x
ethanol
C
P,L,water
T
ref
E
H
H
V
y
ethanol
y
ethanol
λ
ethanol
C
P,V,ethanol
T
ref
y
ethanol
λ
water
C
P,V,water
T
ref
where is the latent heat of vaporization of chemical species at =273.15Kelvin and and are the heat capacities for the liquid and the gas phases of chemical species , respectively; is a slowly-varying function of temperature and can be assumed constant [3]. The mole fractions of ethanol in the liquid and gas phases are denoted by and , respectively. Finally, is the excess enthalpy, which accounts for the nonideal behavior of the liquid mixture. We use the following correlation from [2] to compute the excess enthalpy as a function of composition and temperature:
λ
i
i
T
ref
C
P,L,i
C
P,V,i
i
λ
i
x
ethanol
y
ethanol
E
H
E
H
x
ethanol
x
ethanol
a
0
a
0.5
0.5
x
ethanol
a
1.5
1.5
x
ethanol
a
2.5
2.5
x
ethanol
a
4.5
4.5
x
ethanol
T
x
ethanol
a
m
b
m
c
m
d
m
2
T
m=0,0.5,1.5,2.5,4.5
b
m
c
m
d
m
The first snapshot of the Ponchon–Savarit diagram for is in full agreement with Figure 2-4 in [1].
P=760mmHg
Finally, the "tie lines", displayed in green, show the composition of the two phases that exist in equilibrium at the specified temperature. At the azeotropic composition the tie line is shown in red; it is vertical, confirming that = at the azeotrope. At , the azeotrope composition in terms of ethanol weight fraction is 96% and the boiling temperature is .
x
ethanol
y
ethanol
P=760mmHg
T=78.16°C