Orbit Diagram of the Logistic Map
Orbit Diagram of the Logistic Map


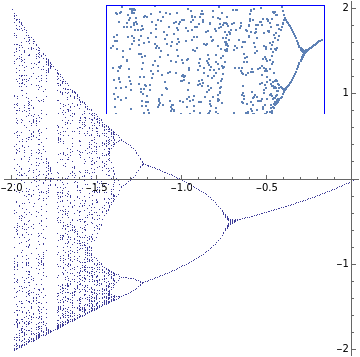
Plot the points , where =0 and the are the iterates of the quadratic map . Each leads to a distinct orbit; for example, for , the orbit is 0, -1.5, 0.75, -0.9375, …. For constant λ, the set of is infinite, but in this picture only a finite sample is shown. The whole plot is called the orbit diagram for the map. The set of points on the right that looks like a curve consists of stable points. In the middle the points orbit between two values. Both of these cases are examples of attractors.
(λ,)
x
n
x
0
x
n
x↦+λ
2
x
λ
λ=1.5
x
n