Optimum Cycle Period for Batch Reactor with Downtime
Optimum Cycle Period for Batch Reactor with Downtime


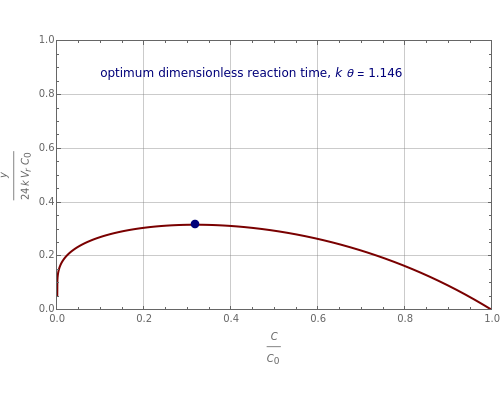
Consider a first-order reaction taking place in a batch reactor. This Demonstration finds the optimum cycle period for this reaction with downtime (expressed in hours) equal to . This point is shown by a blue dot. The red curve represents the plot of the dimensionless daily yield, , versus the dimensionless concentration, , where is the initial concentration in the batch reactor, is the number of daily batches equal to , is the reaction duration, and is the reactor's volume. You can see the effect of varying the dimensionless downtime, , where is the reaction's rate constant. It is clear that low dimensionless reaction times are more favorable when the dimensionless downtime is low. On the other hand, if the dimensionless downtime is high, then the optimum dimensionless reaction time will be high.
θ
d
y=(-C)n
V
r
C
0
C
C
0
C
0
n
24
θ+
θ
d
θ=ln
1
k
C
0
C
V
r
k
θ
d
k