Nullcline Plot
Nullcline Plot

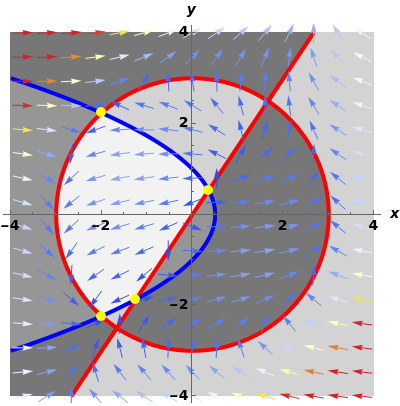
A nullcline plot for a system of two nonlinear differential equations provides a quick tool to analyze the long-term behavior of the system. The and nullclines (, ) are shown in red and blue, respectively. The nullclines separate the phase plane into regions in which the vector field points in one of four directions: NE, SE, SW, or NW (indicated here by different shades of gray). The equilibrium points of the system are the points of intersection of the two kinds of nullclines. Hovering over an equilibrium point displays a tooltip with the eigenvalues of the linearization of the system at that point.
x
y
x'=0
y'=0