Null Distribution of the Correlation Coefficient
Null Distribution of the Correlation Coefficient


The Pearson correlation coefficient, , is considered in most introductory statistics courses. One of the questions students may ask is how large needs to be before it is likely to be important. Before presenting a formal significance test, it is helpful to show some simulations.
r
|r|
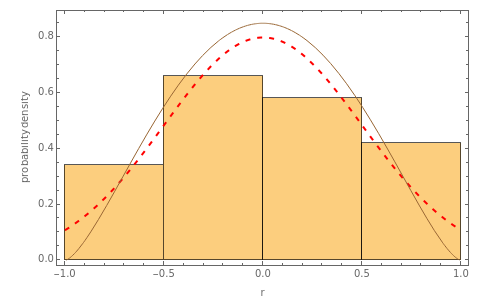
Simulations of independent normal and are used to compute the Pearson correlation coefficient . The histogram of is obtained and compared with its exact distribution (solid curve) and a normal approximation (red curve with dashing). As increases from 5 to 30, the exact distribution closely approximates the normal and it becomes much more narrowly focused on the true value. The histogram with only 100 simulations is shown. Increase the number of simulations to get a more accurate histogram density estimate.
n
x
y
r
r
n
The robustness of the distribution of may be examined by examining the histograms when the and/or has a non-normal distribution. The exponential and distributions may be selected.
r
x
y
t
(5)