WOLFRAM|DEMONSTRATIONS PROJECT

NPV and its Contributions

​
discount rate (0 - 40%)
0.1
initial year initial outlay ($000's)
1
average sales price ($1-500)
1
sales quantity (ea)
1
manufacturing cost (as % of sales)
0.001
GSA expense (as % of sales)
0.001
year 1
avg sales price ($)
1
sales quantity (ea)
1
manufacturing cost (as % of sales)
0.001
GSA expense (as % of sales)
0.001
year 2
avg sales price ($)
1
sales quantity (ea)
1
manufacturing cost (as % of sales)
0.001
GSA expense (as % of sales)
0.001
year
gross income
mfg cost
SGA expense
oper'g income
initial
0
0
0
0
1
0
0
0
0
2
0
0
0
0
NPV
first 3 years' operating income as fraction of gross income
NPV/cap inv
-1.00
1.00
1.00
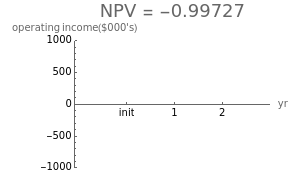
Net Present Value (NPV), the sum of discounted cash flows, is an approach used to judge whether to undertake a new product-commercialization project and/or a way to compare the relative value of proposed projects competing for the same resources. The higher the NPV, the better return the project has for the business. This Demonstration allows for the quick computation and visualization of NPV over a three-year period.