Morphing Cartesian to Polar Coordinates
Morphing Cartesian to Polar Coordinates

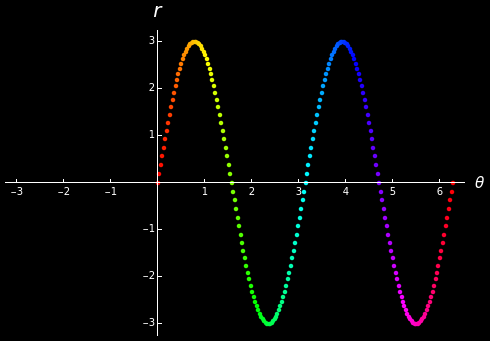
This Demonstration helps you visualize how a rectangular graph becomes a polar graph. Given a function , each point is initially graphed in a - plane using a rectangular coordinate system. The points are then moved along linear paths to their corresponding polar locations in the - plane. Colors help indicate which points end up where and how the relative extrema become extrema in the polar graph. Constant and constant illustrate how the rectangular grid becomes a polar grid.
r=f(θ)
(r,θ)
θ
r
x
y
r
θ