Mohr's Circle and Stress Transformations
Mohr's Circle and Stress Transformations


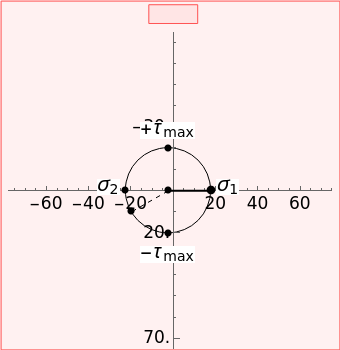
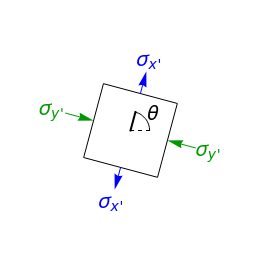
This Demonstration uses a Mohr’s circle and a stress plot to show the effects of stress transformation on a differential element or area. Use sliders to vary the stresses , and , which correspond to the stresses on the differential element at (dashed black line). Select "set angle" to vary the angle with a slider. Stress transformation equations are used to compute the transformed stresses , and (solid black line), which are shown on the differential stress element as blue, green and black arrows, respectively. Select the "Mohr's circle" button to display Mohr's circle on the left. An angle of on the differential stress element corresponds to an angle of on the Mohr's circle. Select the "stress plot" button to display a plot of all three transformed stresses versus on the left. Select "set angle" to set with a slider or "critical stresses" to snap the diagram to the angle of one of the principal stresses ( and ) or one of the maximum in-plane shear stresses ( and ). Note that Mohr’s circle is displayed with positive in the downward direction, so an increase in results in a counterclockwise rotation on both the Mohr's circle and the differential stress element.
σ
x
σ
y
τ
xy
θ=0°
θ
σ
x'
σ
y'
τ
x'y'
θ
2θ
θ
θ
σ
1
σ
2
+
τ
max
-
τ
max
+
τ
xy
θ