Mixing in Two Connected Tanks
Mixing in Two Connected Tanks


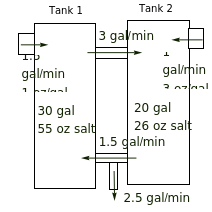
Pipes carrying brine at different rates and concentrations connect two tanks.
The diagram (see Figure 3.2.9 in [1]) shows the initial concentrations of salt, the volumes of brine, the flow rates and the concentrations of brine flowing in, and the flow rates between the tanks and going out.
Let (t) and (t) be the amount of salt (in ounces) in tanks 1 and 2. The equations for the time rates of change of and are
u
1
u
2
u
1
u
2
d
u
1
dt
u
1
u
2
d
u
2
dt
u
1
u
2
The constant coefficients , , , , , are related to the various rates of flow as follows:
a
b
c
d
e
f
coefficient | from | to | rate(gal/min) |
a | tank1 | tank2 | -3 |
b | tank2 | tank1 | 1.5 |
c | outside | tank1 | 1.5 |
d | tank2 | tank1 | 3 |
e | tank2 | tank1andoutside | -1.5and-2.5 |
f | outside | tank2 | 1 |
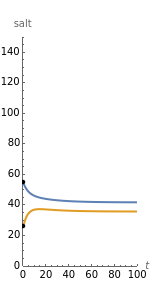
This Demonstration shows the resulting salt solution in each tank by a change in color and in the graph. The system tends to steady state over time. For example, set the input brine to zero for both tanks and watch as the solution in both goes to zero. The steady state can be obtained deductively for some solutions.